Hoenergy Smart Energy Storage Management Platform Operation Manual
Version: V1.0.0 Revision Date: 2025-07-26 Revision Type: A — First Release
1. Overview
1.1. Platform Introduction
A full lifecycle management platform for industrial and commercial energy storage systems.
- Station-level and device-level data visualization.
- Centralized management of operational metrics across multiple stations.
- Unified control of energy storage, photovoltaic (PV), and charging devices.
- Flexible configuration of control strategies based on time periods, battery state, and load type.
- Dynamically generated daily, monthly, and yearly operational and revenue reports.
- Big-data-based value mining, AI prediction, and decision analysis.
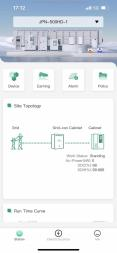
- Future expansion into a fully featured mobile platform for Android or iOS systems.
1.2. Scope of Application
This document applies to all users of the Hoenergy Smart Energy Storage Management Platform.
1.3. Document Description
| No. | Version | Revision Date | Type | Revision Content |
|---|---|---|---|---|
| 1 | V1.0.0 | 2025-07-26 | A | First Release |
2. System Environment
2.1. Environment Requirements
Supported browsers and versions:
| Browser | Version Requirement |
|---|---|
| Chrome | The latest version of Google Chrome |
| Firefox | 106.0.5 |
| Edge | 106.0.1370.52 |
| 360 Browser | 13.1.1469.0 |
| Sogou Browser | 11.0.1.34700 |
| Cheetah Browser | 8.0.0.21681.8012 |
| QQ Browser | 11.1.22000.0 |
3. System Login
3.1. System Login
- Open the URL https://ecloud.hoenergypower.cn, enter the correct username and password, and click Log in to enter the system.
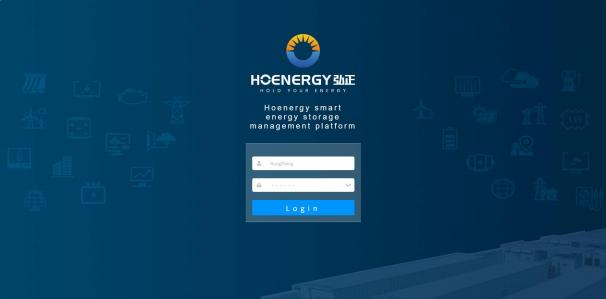
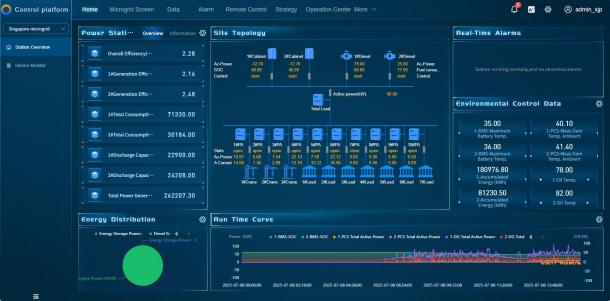
- After successful login, the system defaults to the Energy Storage Overview — Energy Storage Home page.
3.2. Logout
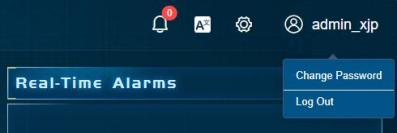
- Click Account — Logout in the upper right corner to safely exit the system.
3.3. Change Password
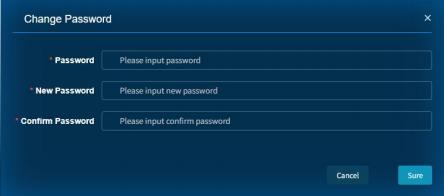
- Click Account — Change Password in the upper right corner to enter this page.
Enter the old password and the new password correctly as prompted. The new password must be 6–18 digits or characters in length. After submission, the change is successful; please log in again.
4. System Functions
4.1. Main Function Modules
This platform includes the following main function modules:
Home, Data, Alarms, Remote Control, Strategy, Operations Center, Revenue Analysis.

4.2. Detailed Function Description
4.2.1. Home
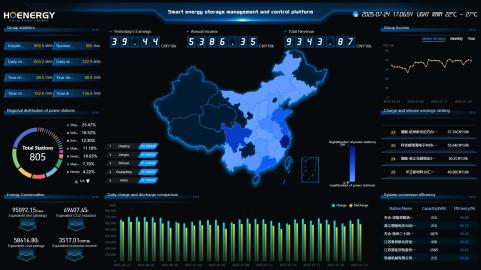
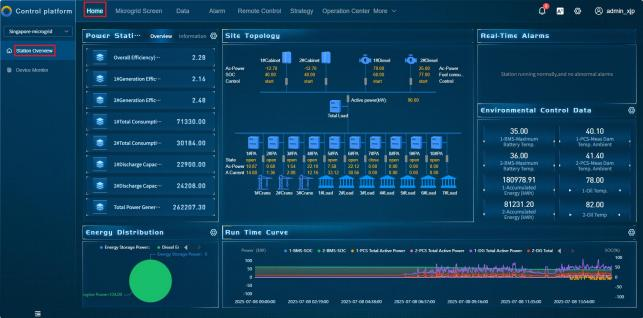
Click Home — Station Overview to enter the Home page. This page displays the overall station data, device topology diagram, cumulative charge/discharge statistics, real-time operating curves, alarm information, environmental control data, and more.
4.2.1.1. Device Monitoring
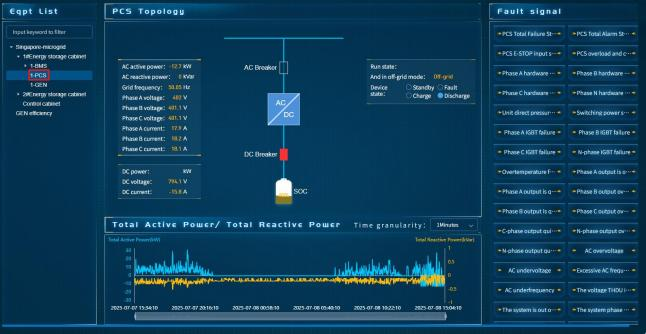
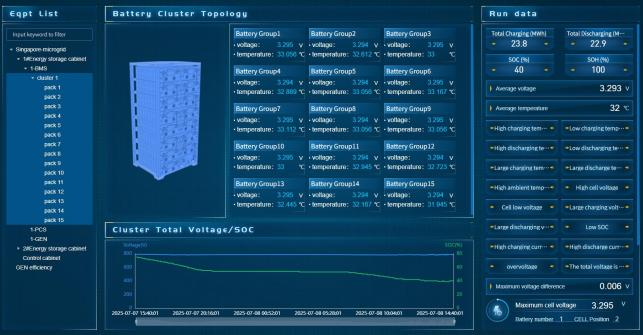
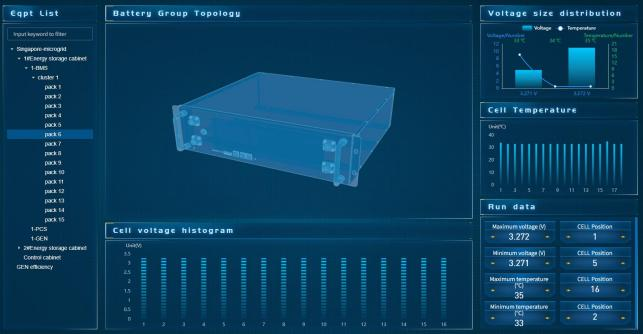
Click Home — Device Monitoring to enter this page. The list displays all devices under the station in a hierarchical structure. Click a specific device to view its corresponding page and operating data.
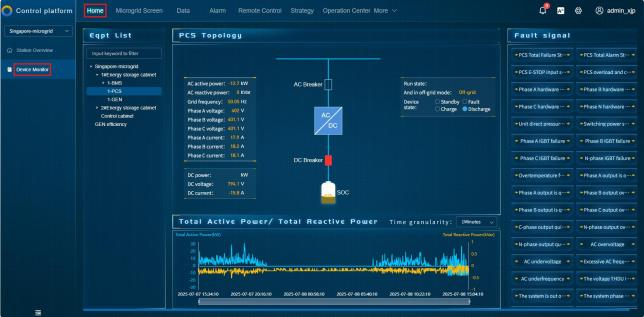 PCS Display Page: Mainly displays key data such as voltage, current, and power, as well as operating status.
 Battery Cluster Display Page: Mainly displays key data such as voltage, temperature, and State of Charge (SOC), as well as operating status.
 Battery Pack Display Page: Mainly displays key data such as individual cell voltage and individual cell temperature, as well as operating status.
4.2.2. Data
4.2.2.1. Real-time Data
- Click Data — Real-time Data to enter this page. This page allows you to view the real-time values and historical data of all device telemetry and teleindication points.
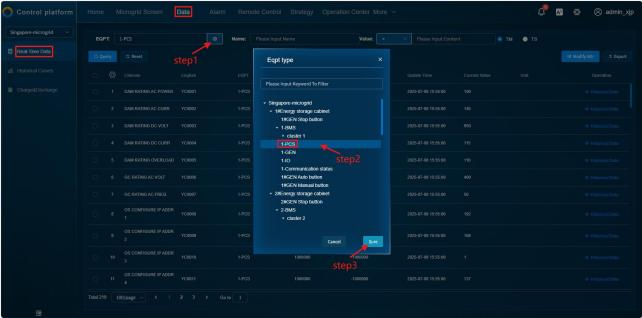
- Real-time Data: For example, when querying PCS data, click the search box, select the PCS device, and click OK to query.
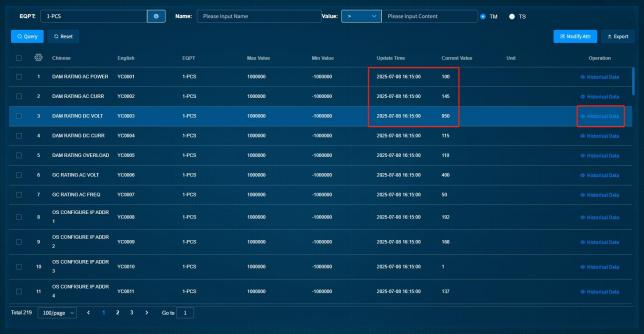
- After the query is complete, the real-time data and data refresh time of the PCS device can be seen. Click to view historical data.
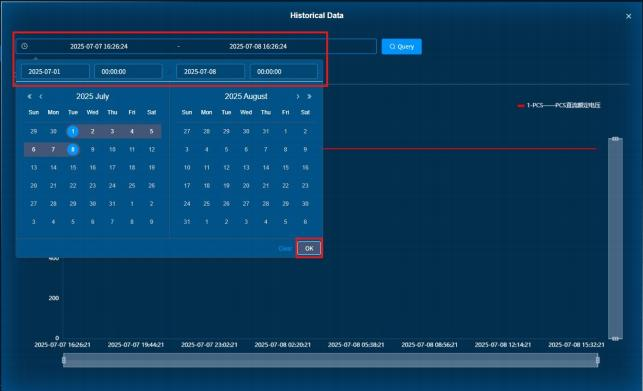
- Select the date and time to query, and click OK to view the historical data curve.
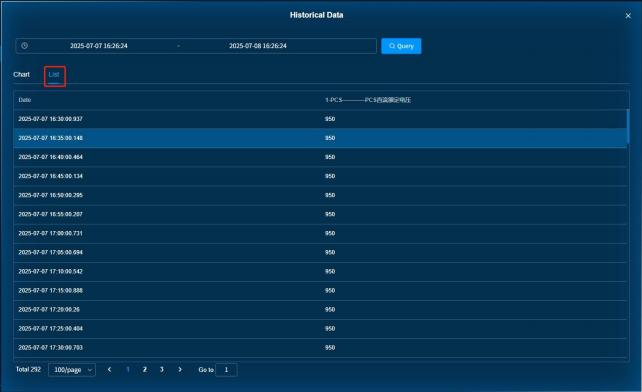
- Click List to view the corresponding timestamps and values.
4.2.2.2. Historical Curve
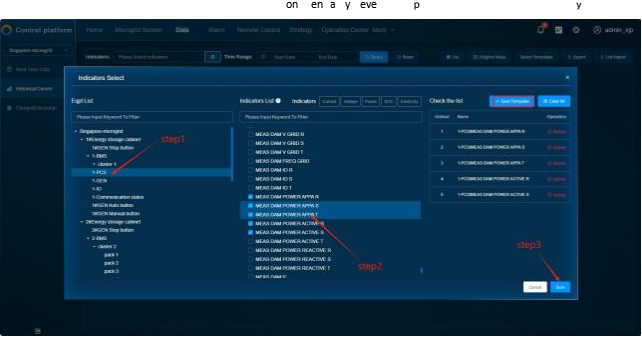
- Click Historical Curve, select the device and measurement point to query, click OK, and set it as the template for the next query.
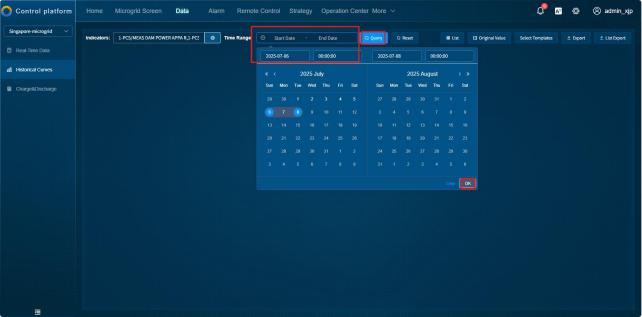
- Select the date and time to query (accurate to the second), click OK, and then click Query.
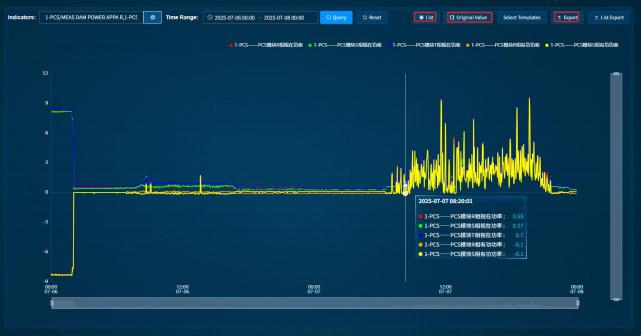
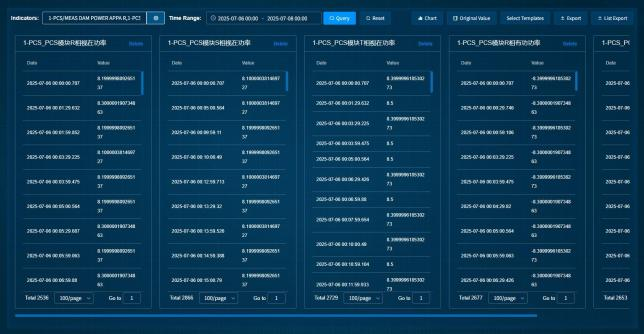
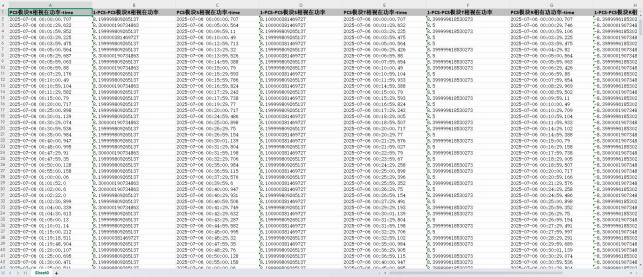
- Place the mouse cursor on the curve to display the value. Click List in the upper right corner to convert the curve into a list view of values. Click Raw Value to obtain the actual values uploaded by the device. Export is also supported.
4.2.2.3. Charge/Discharge
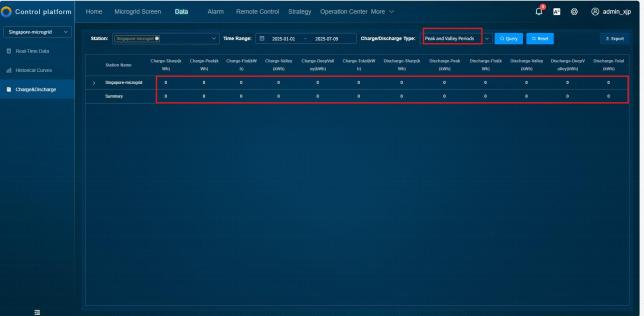
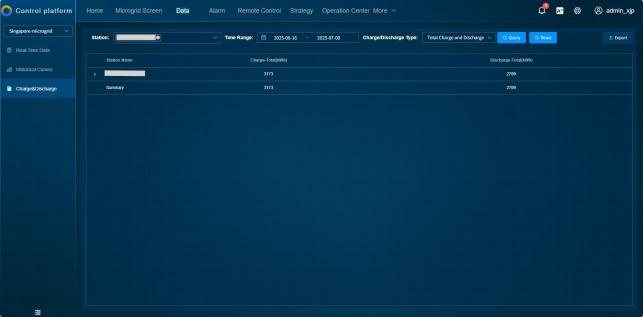
- Click Data — Charge/Discharge, select Station, Time Period, and Charge/Discharge Type (Peak/Flat/Valley time periods, Total Charge/Total Discharge), and then click Query to view the charge/discharge data.
4.2.3. Alarms
4.2.3.1. Real-time Alarms
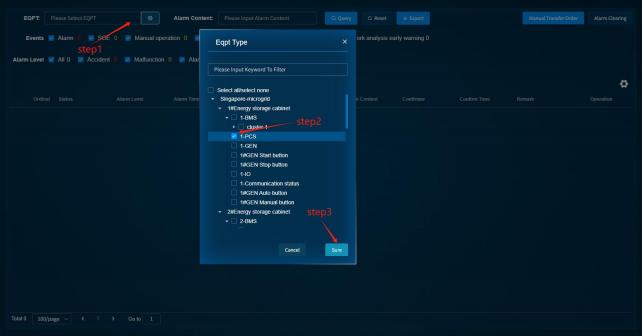
- Click Alarms — Real-time Alarms to enter this page. This page displays all ongoing and unrecovered alarm information, including alarm time, alarm device, alarm content, and acknowledger.
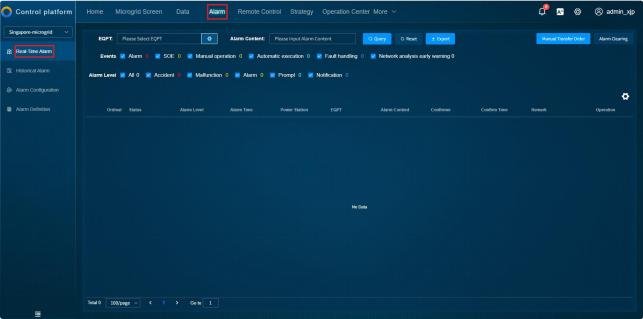
- Filter view by device.
4.2.3.2. Historical Alarms
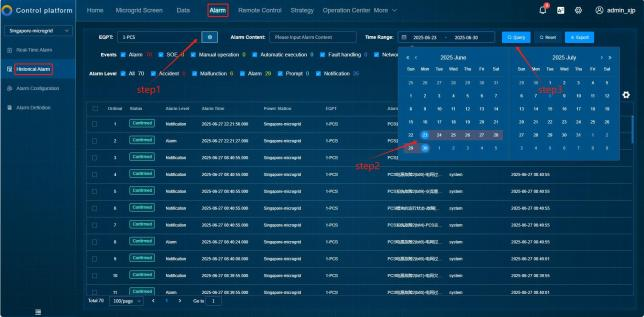
- Click Alarms — Historical Alarms to enter the Historical Alarms page. This page displays the historical alarm information of all devices, including alarm time, alarm device, alarm content, and acknowledger.
- You can select a device and any time period to filter and view.
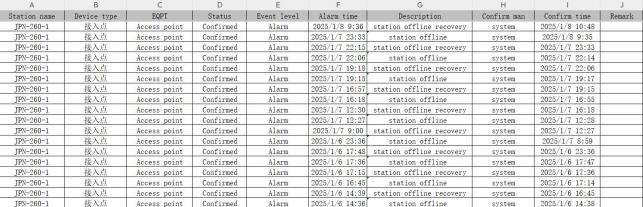
- Click Export to export alarm information as a spreadsheet for easy archiving.
4.2.3.3. Alarm Configuration
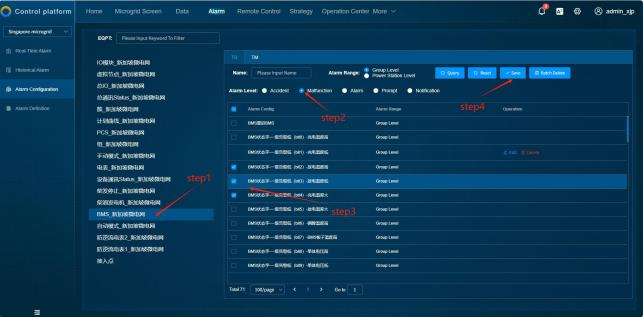
- Click Alarms — Alarm Configuration, users can customize the configuration of Accident, Fault, Alarm, Prompt, Notification, etc.
- Select the device to configure, select the alarm level, select the measurement point, and click Save.
4.2.4. Remote Control
4.2.4.1. Command Issuance
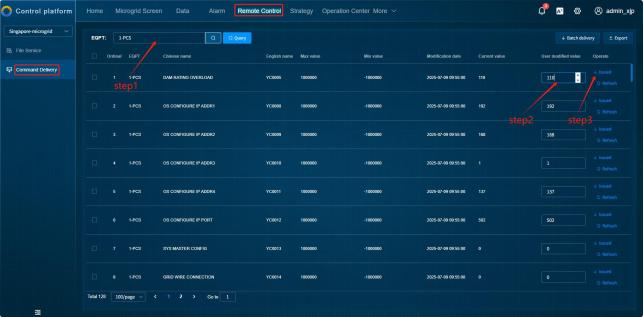
- Click Remote Control — Command Issuance to enter the Command Issuance page. This page allows remote modification of the values of controllable points on each device and their issuance to the device.
- Select the device to control remotely, enter the set parameters, and click Issue.
4.2.5. Strategy
4.2.5.1. Plan — Curve Template
- Click Strategy — Plan — Curve Template to enter this page. This page displays all planned curve templates under the station and supports creating, editing, and deleting planned curve templates, as well as setting template enable status.
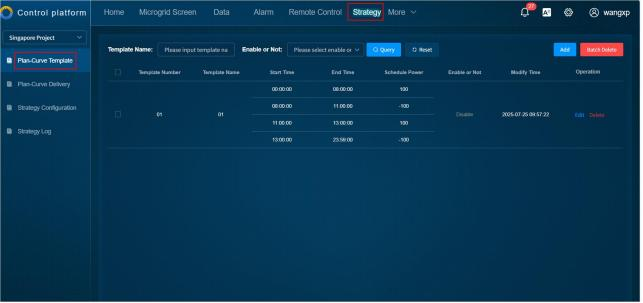
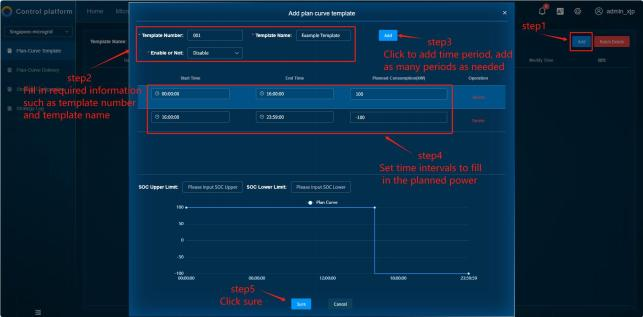
- Click the upper right corner to add a new template.
4.2.5.2. Plan — Curve Issuance
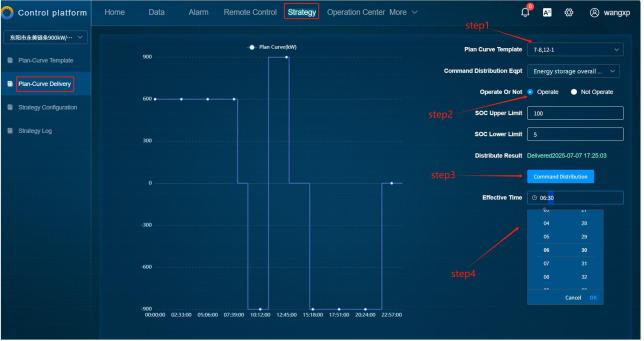
- Click Strategy — Plan — Curve Issuance to enter this page.
- Select the template and the device to issue to, and click the Issue Command button to successfully issue the operation plan to the device.
- You can freely select the template effective time.
4.2.5.3. Strategy Log
- Click Strategy — Strategy Log to view the strategy logs of the current station.
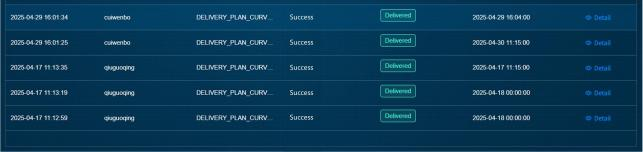
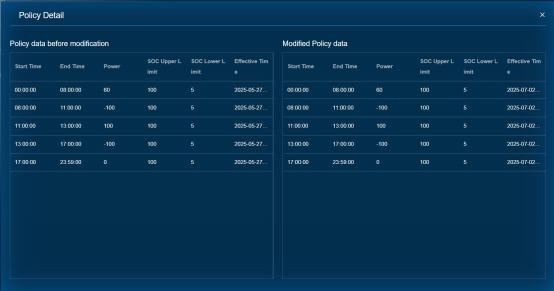
- Click the Details button of a data entry to view the specific details of the strategy issuance.
4.2.6. Operations Center
4.2.6.1. Process Definition
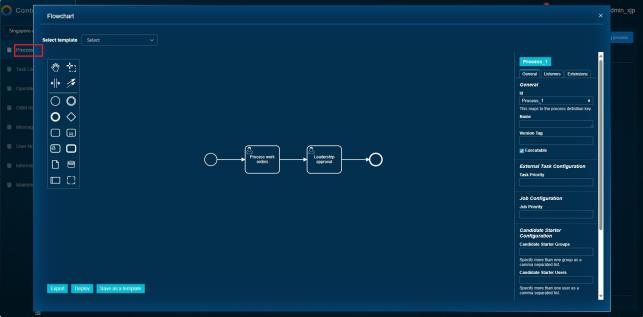
- Click Operations Center — Process Definition to freely define operation processes.
4.2.6.2. Operation Workflow
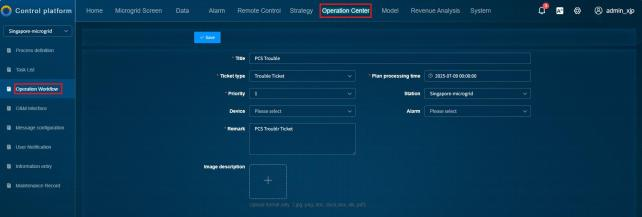
- Click Operations Center — Operation Workflow to create operation workflows.
4.2.7. Revenue Analysis
4.2.7.1. Custom Electricity Price
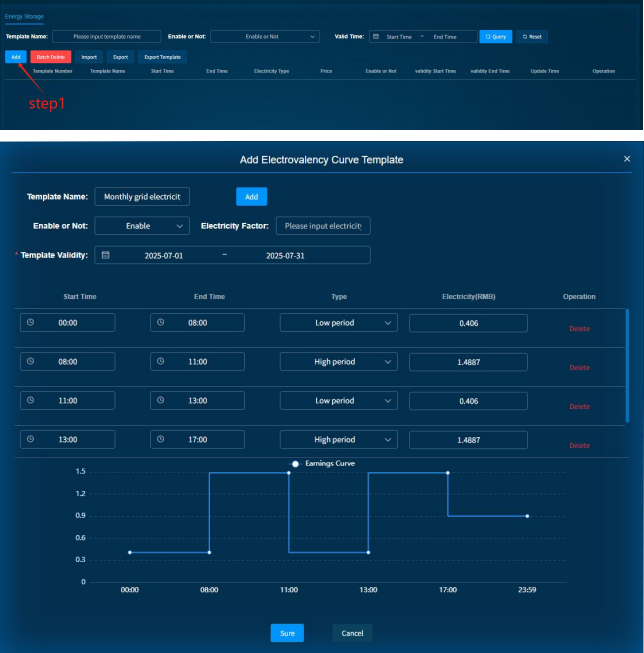
- Click Revenue Analysis — Custom Electricity Price — Add to define a local electricity price.
4.2.7.2. Revenue Report
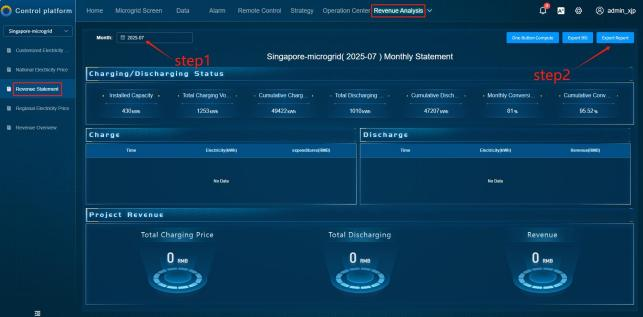
- Click Revenue Analysis — Revenue Report, select a month to view the revenue status, and click the Export Report button to export the report.
4.2.7.3. Revenue Overview
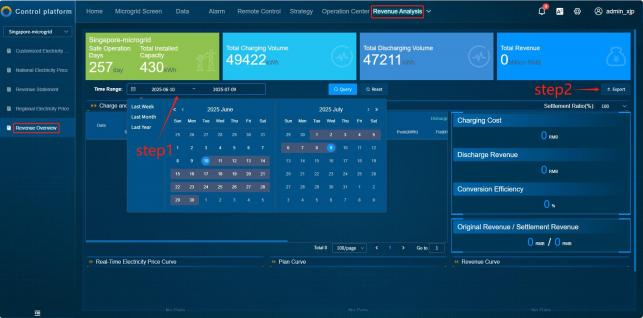
- Click Revenue Analysis — Revenue Overview, select a time period to view the revenue status, and click Export to export.