
Part 1 General Description
1. Introduction
1.1 Hardware Interface
1.1.1 D-Cube-A Series Hardware Interface Debugging Connection Method
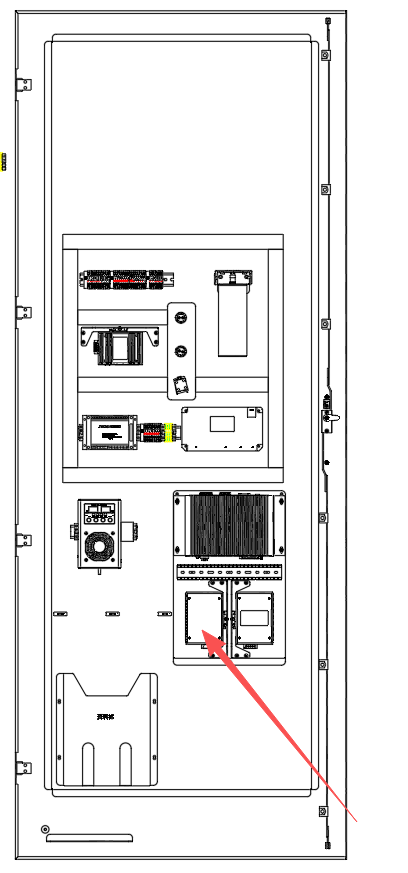
A Windows laptop is required. Use an Ethernet cable to connect to any LAN port of the switch inside the cabinet.
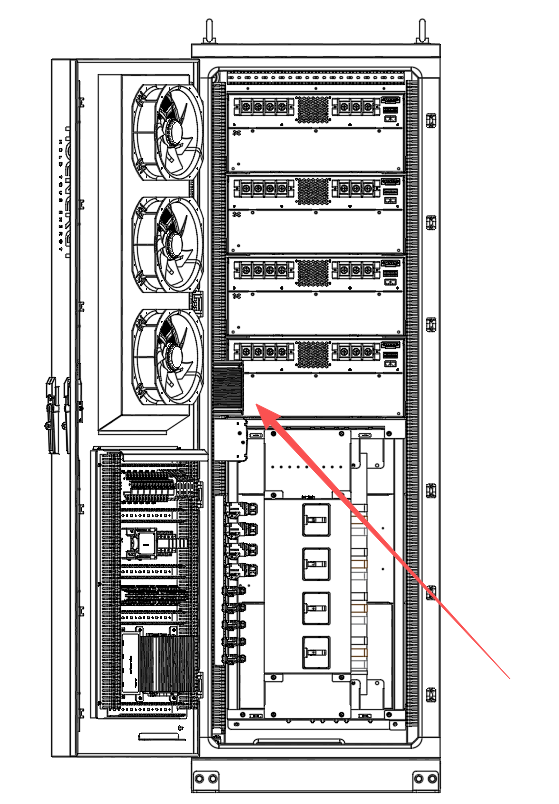
1.1.2 D-Cube-S125/261-EU Hardware Interface Debugging Connection Method:
A Windows laptop is required. Use an Ethernet cable to connect to the ETH port on the front panel of the PCS inside the cabinet.
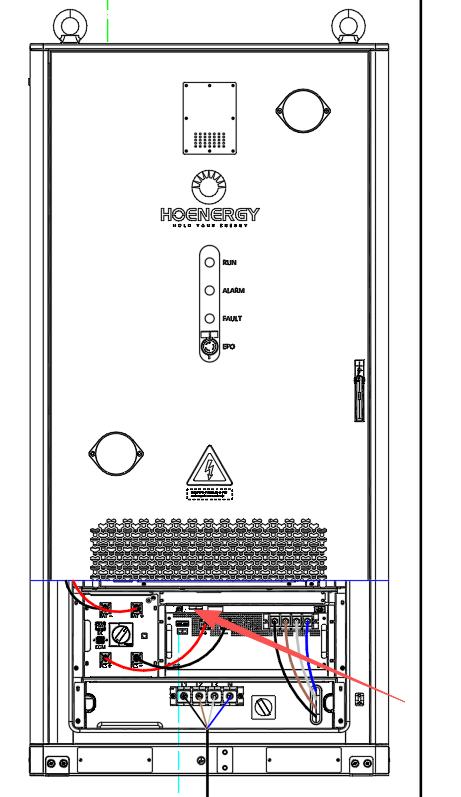
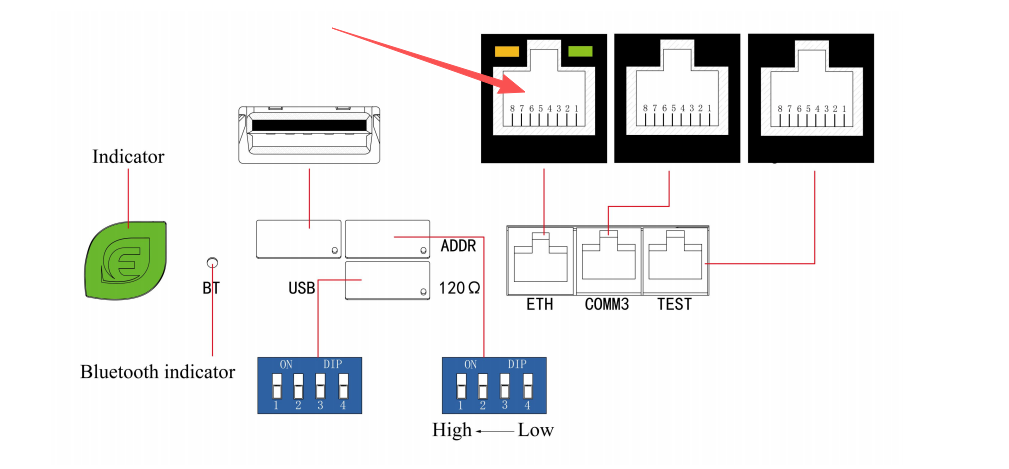
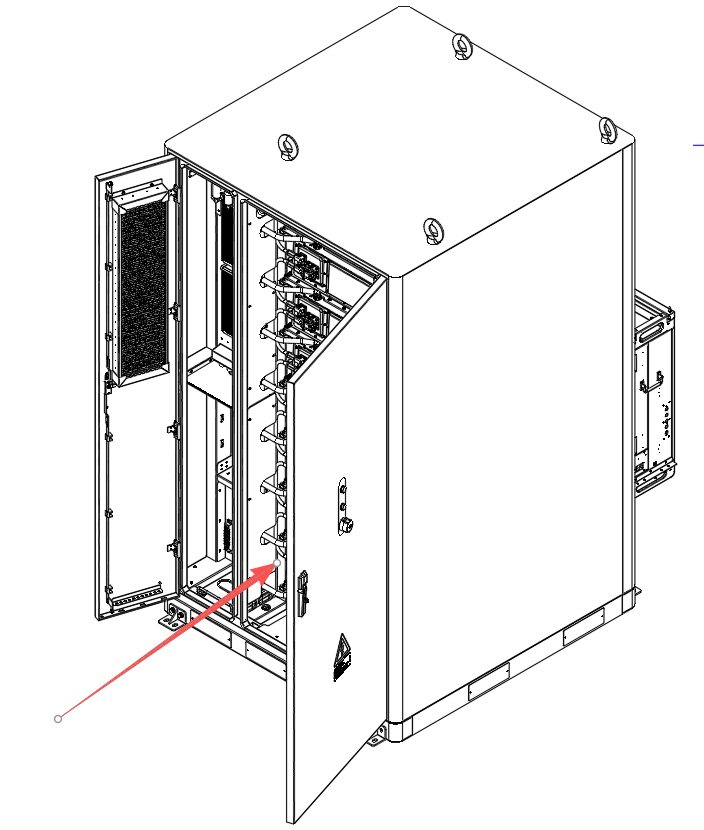
1.1.3 D-Cube-F215/418 Hardware Interface Debugging Connection Method
A Windows laptop is required. Use an Ethernet cable to connect to any LAN port of the switch inside the cabinet.
1.2 Left Side Function Area
MonitorParameter is used for operation monitoring, data acquisition, parameter configuration, and troubleshooting of Enjoy Technology Co., Ltd power electronics equipment. It supports Modbus TCP, Modbus Uart, and other communication methods, and is applicable to equipment commissioning and operation status management.
2. Software Interface Description
2.1 Left Function Area
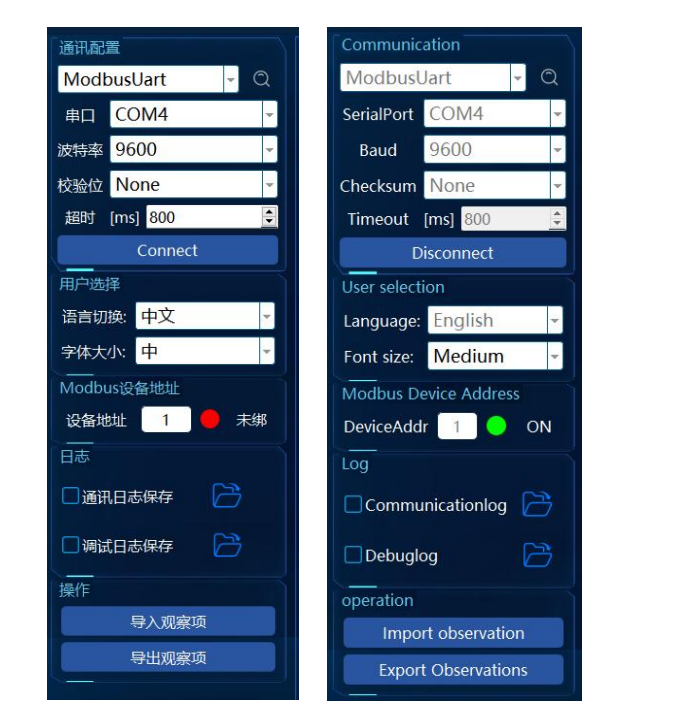
Figure: Software Main Interface: Left Function Area
2.1.1 Communication Settings
| Field | Description | Example |
|---|---|---|
| Serial Port | Select the serial port for connecting the device | COM4 |
| Baud Rate | Set the communication baud rate | 9600 |
| Parity | Select the communication parity mode | None |
| Timeout | Set the communication timeout for data packets | 800 ms |
| Device Address | Set the Modbus address of the communication device | 1 |
| Connection Status | Indicates whether the device has been successfully connected | Connected |
2.1.2 Operation Options
- Import Watch Items: Import the list of parameters to be monitored via a json file.
- Export Watch Items: Export the current list of monitored parameters as a json file for easy saving and sharing.
2.1.3 Log Management
- Communication Log Saving: Records the communication data between the device and the software.
- Debug Log Saving: Saves debugging information for subsequent problem analysis.
2.2 Right-Side Monitoring Area
2.2.1 Parameter Monitoring Table
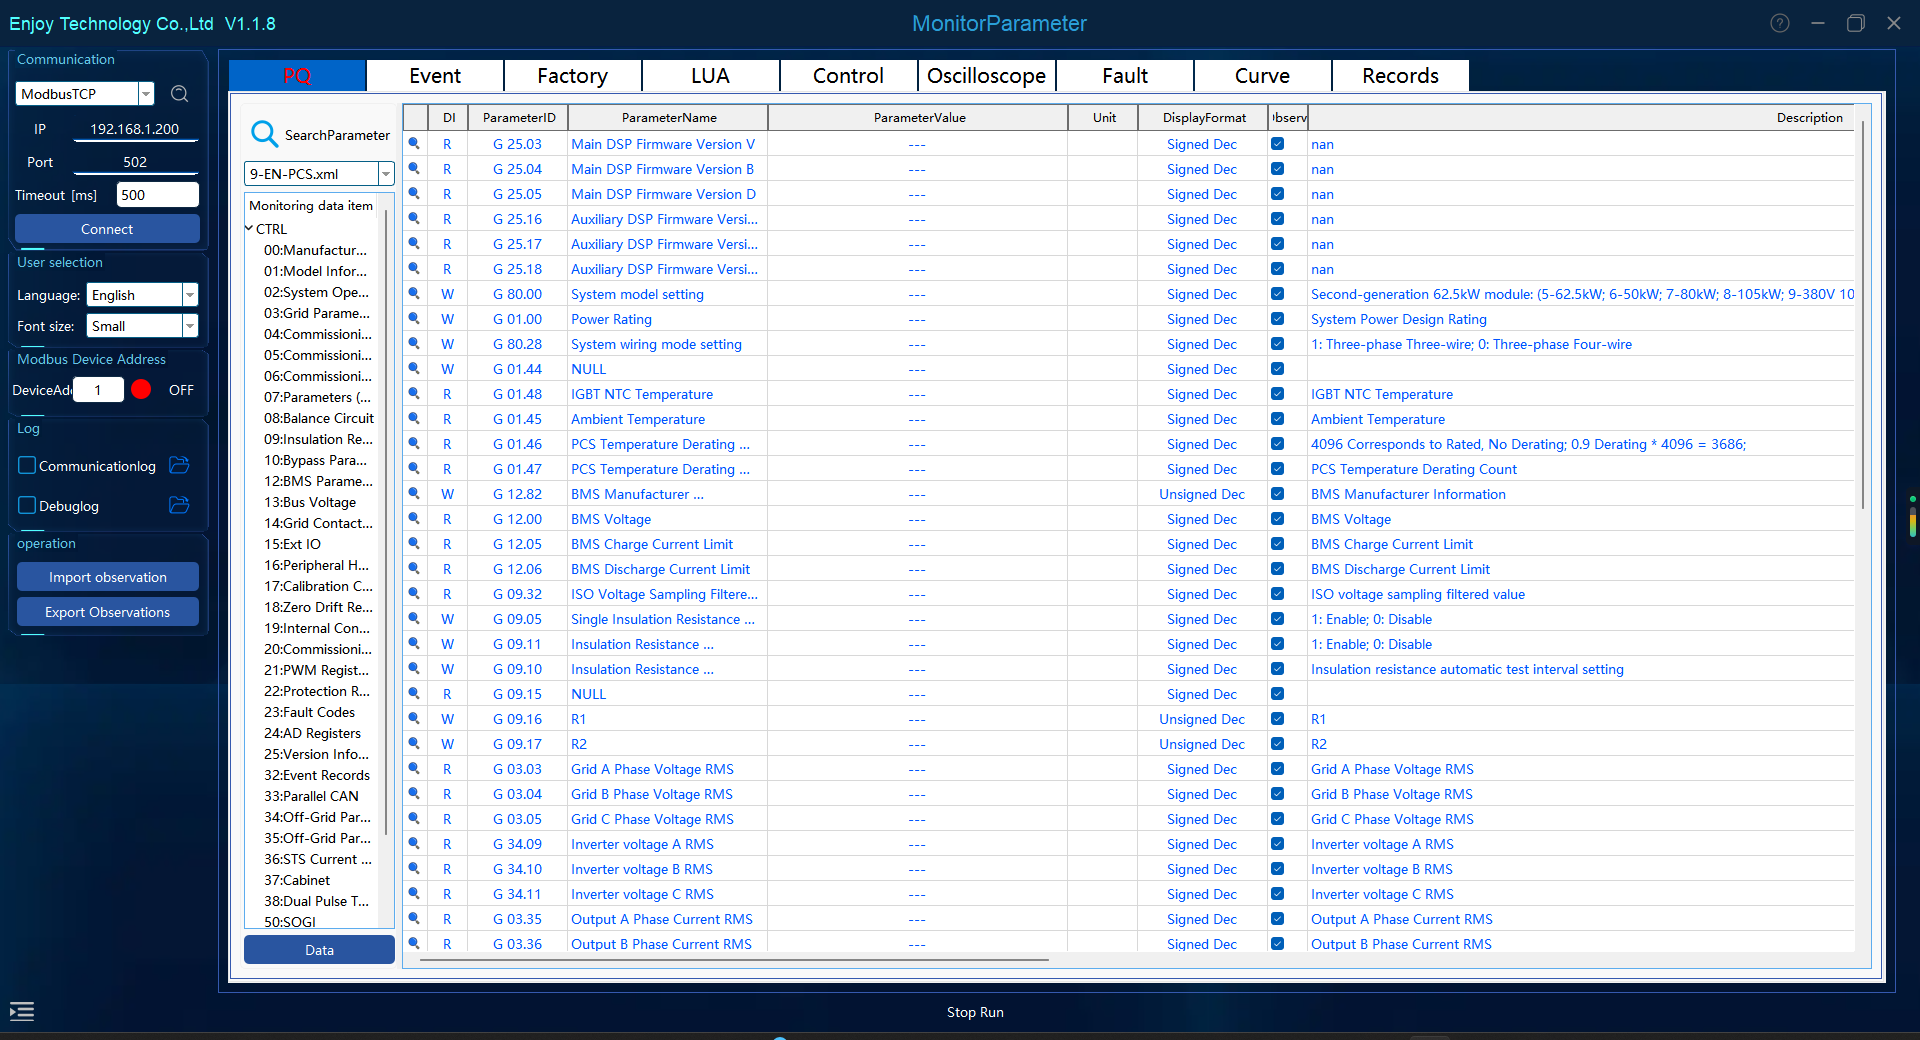
- Parameter Module: Displays the monitoring data of the device.
| Field | Description | Example |
|---|---|---|
| ParameterID | Unique identifier of the parameter | G 00.32 |
| Parameter Name | Specific meaning of the displayed parameter | "Year", "Ambient Temperature" |
| Parameter Value | Real-time data returned by the device | 27.0 °C |
| Unit | Physical unit of the parameter | °C |
| Display Format | Display method of the parameter value | Signed Dec |
| Watch Option | When checked, enables focused monitoring of specific parameters | Checked |
2.2.2 Tab Description
- PQ Parameters: Displays the real-time parameters related to the device's power quality.
- Event Records: Records the operating events of the device and supports fault analysis.
2.3 Bottom Status Bar

- Hide Option: Click to hide the left function area; click again to unhide.
- Communication Status: Displays the current communication method and communication configuration, e.g.,
Modbus UART: COM4:9600-N-8-1.
| Field | Description | Example |
|---|---|---|
| Number of Packets Sent (S) | The number of data packets that have been sent | 422 |
| Number of Packets Received (R) | The number of data packets that have been received | 398 |
The bottom status bar displays the real-time communication operating status of the device.
3. Main Functions
3.1 Communication Settings
Configure the communication port and parameters to establish the connection between the device and the software.
3.1.1 Communication Protocol Selection
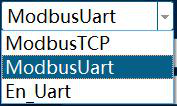
Figure: Communication Protocol Selection and En_Uart Driver Installation
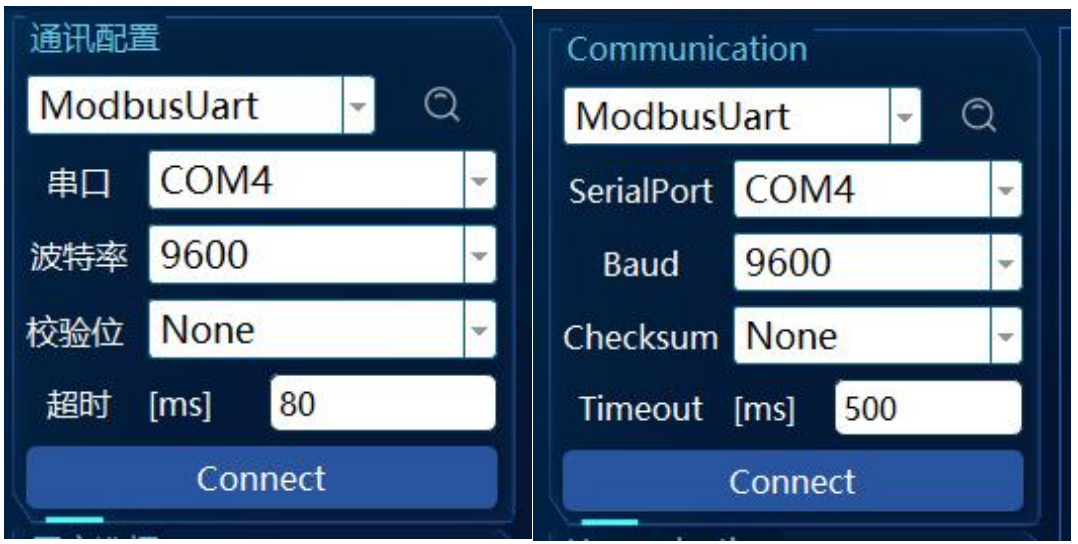
After launching the software, select an appropriate communication protocol as required: ModbusTCP, ModbusUart, or En_Uart.
⚠️ Note: The En_Uart protocol requires a dedicated communication tool. Please ensure that the relevant driver has been installed.
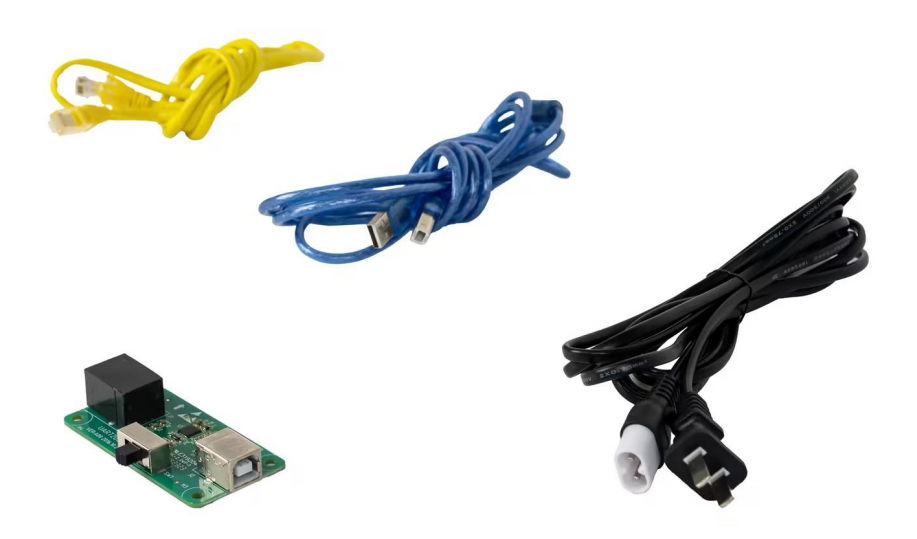
- Driver installation path:
1-Monitor1129 > EN_Uart+ > CP210xVCPInstaller > CP210xVCPInstaller_x64.exe
3.1.2 TCP Connection Method
Figure: TCP/IP Connection Settings
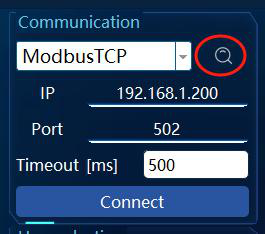
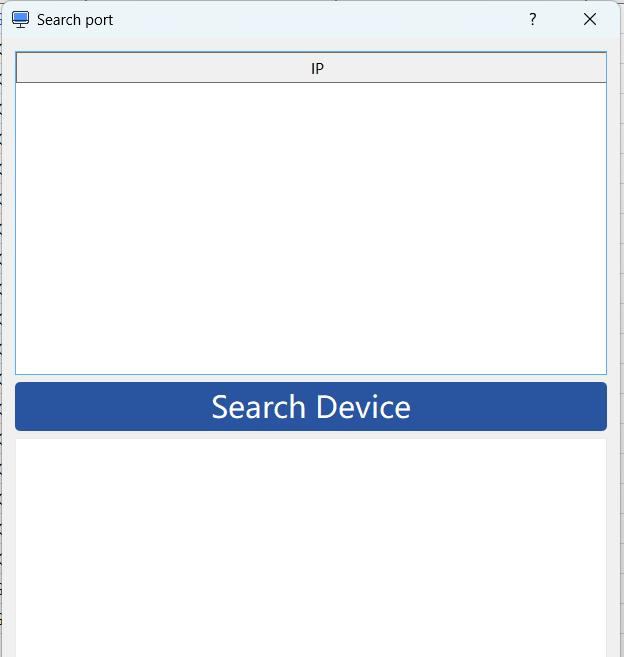
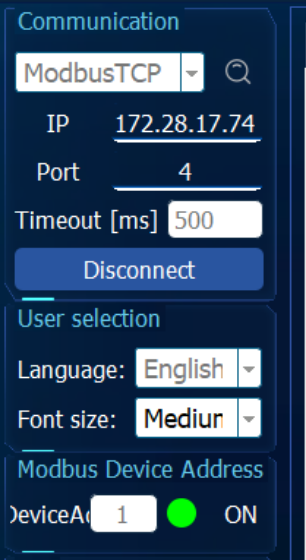
Use a scanning tool to confirm the device's network connection status and IP address: ensure the device communicates properly with the network, and obtain the actual IP address of the device.
3.1.3 Connection
Click the Connect button and ensure the communication status displays as "Connected".
3.2 Model Selection
Figure: Model (Parameter Template) Selection
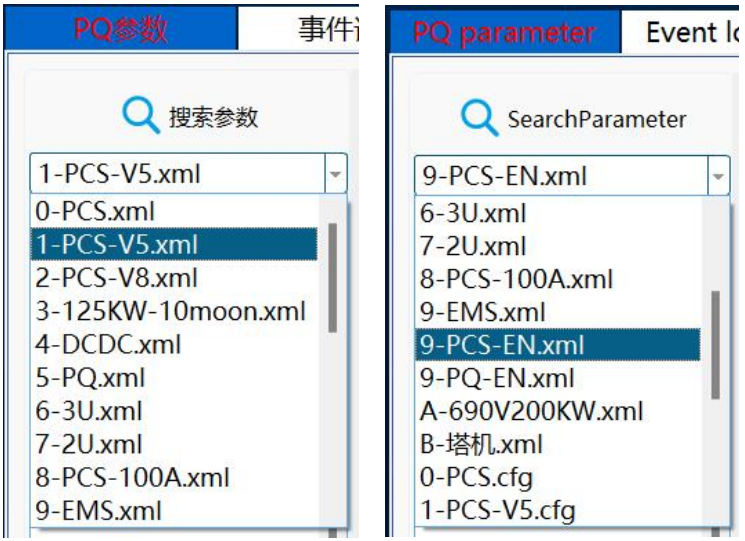
After the device type is selected, the software automatically loads the corresponding monitoring parameter template.
💡 Reminder: - PCS English version selection:
9-PCS-EN.xml- Power Quality English version selection:9-PQ-EN.xml
3.3 Parameter Monitoring
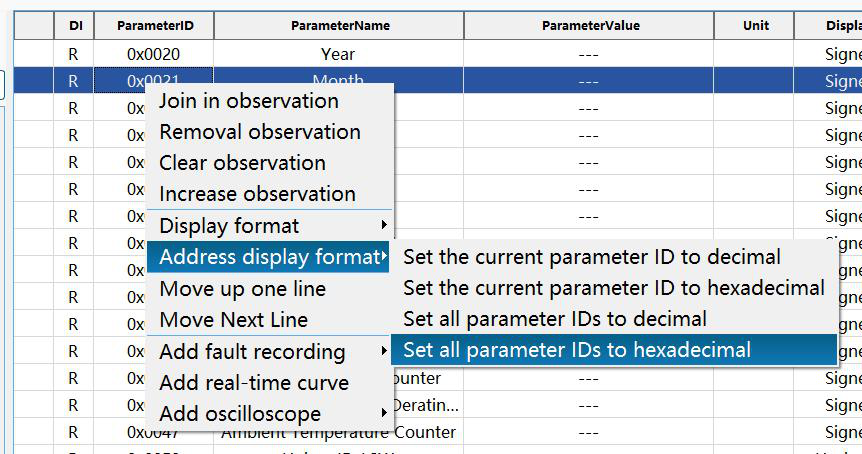
Figure: Parameter Monitoring and Address Display Format
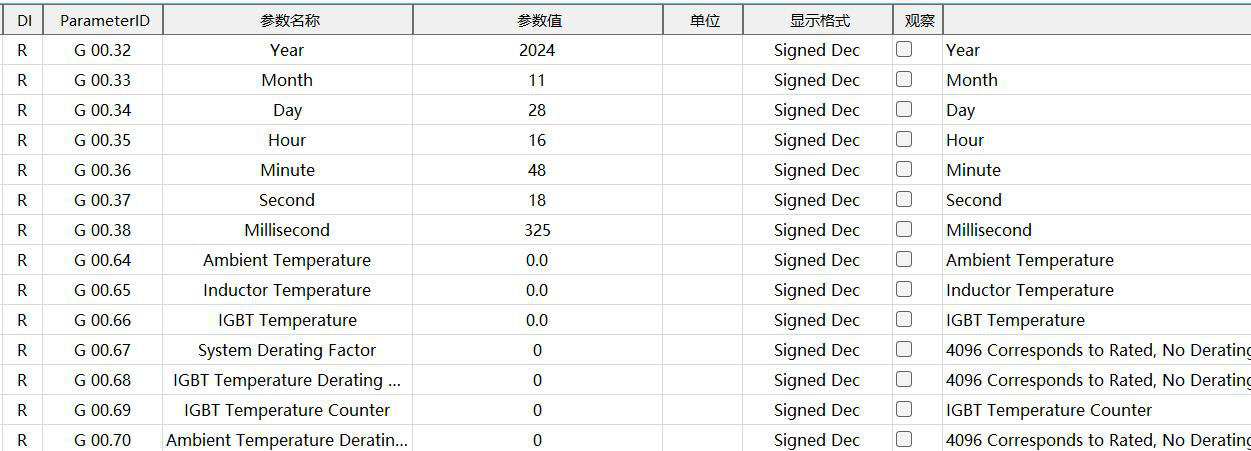
Real-time display of device operating parameters, including key data such as temperature and voltage.
💡 Note: Right-click on the ParameterID of any parameter, select the "Address Display Format" option, and set the current parameter ID to hexadecimal to calculate the corresponding register address. This provides convenience for subsequent EMS development, control, and usage.
3.4 Event Records
Figure: Event Records
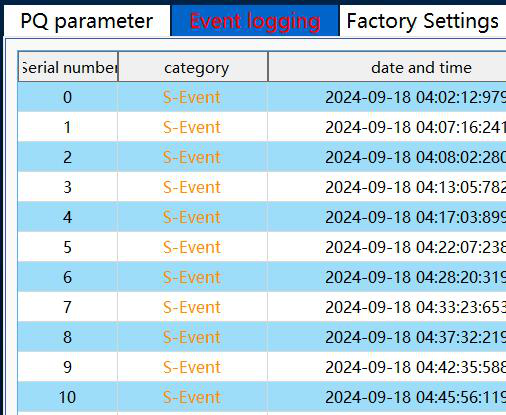
View historical events to assist in troubleshooting.
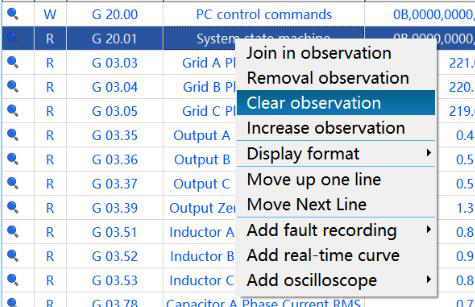
3.5 Clear Monitoring
The "Clear Monitoring" function is used to quickly remove all currently selected monitoring parameters. This function is applicable to scenarios where parameters need to be reconfigured or invalid monitoring items need to be cleared, ensuring that the monitoring interface remains clean and focused.
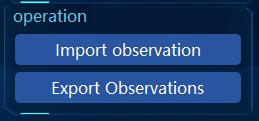
3.6 Import/Export Observations
Figure: Import/Export Observation Items
This feature supports batch import and export operations for commonly used parameters that have been added to observations across different device models. With this feature, users can efficiently share observation parameter configurations between multiple devices, improving operational efficiency and reducing the workload of manual configuration.
Operation Steps:
- Click the Import Observation Items button.
- Select the prepared JSON file (e.g.,
Key Configuration_STS+PCS.json).
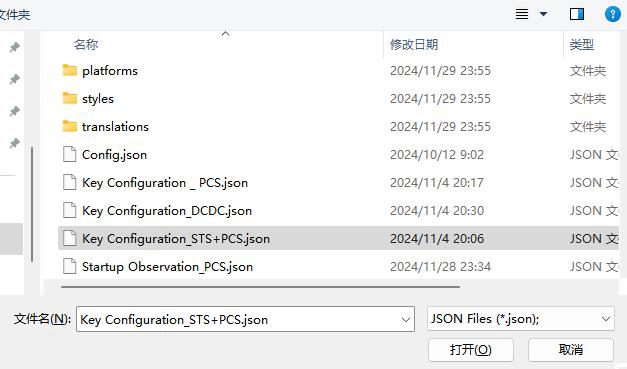
- After import, the key configuration parameter items will be displayed in the monitoring list on the right side.
4. Precautions
- Ensure that the configuration (baud rate, parity bit, etc.) is consistent with the device hardware.
- Avoid multiple devices accessing the same serial port simultaneously during operation.
- Before parameter configuration, please confirm the parameter range to avoid abnormal device operation.
- When using the import function, ensure that the JSON file format is correct.
5. Frequently Asked Questions and Solutions
| Issue | Possible Cause | Solution |
|---|---|---|
| Unable to connect to the device | Incorrect serial port settings or the device is not powered on | Check whether the serial port number, baud rate, and other configurations are correct, and restart the device |
| Parameter display anomaly | Communication interruption or device fault | Check the communication lines and ensure the device is operating normally |
| Unable to import the parameter file | Incorrect file format | Ensure that the JSON file conforms to the standard format supported by the software |
| Lag or no response during runtime | Insufficient PC performance or excessive data volume | Optimize PC performance and reduce the number of monitored parameters |
| Device cannot be discovered | Blocked by firewall | Open the firewall in the PC properties and allow the application through the firewall |
Part II: Backend Software Operation
The original document of this section is mainly composed of interface screenshots; here it is organized into structured operation steps; locations marked with
[Screenshot]are interface diagrams in the original document.
6. Configuration Files
Figure: Configuration Files and Folder Structure
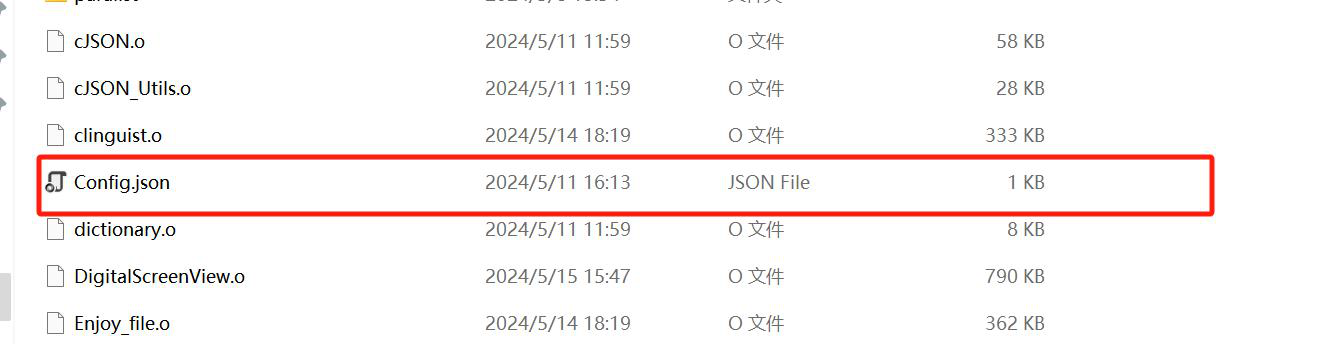
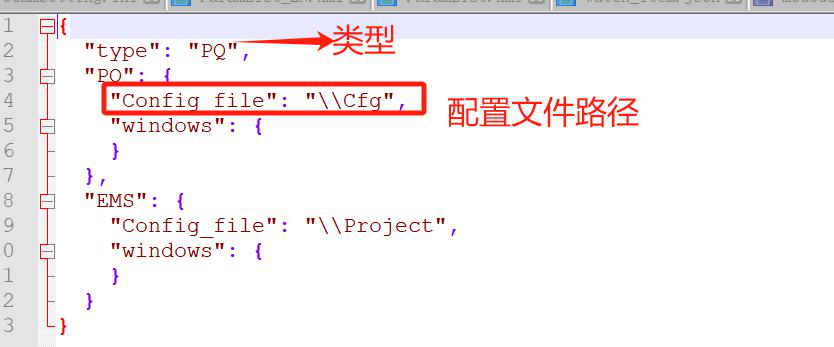
- The software directory should contain the Config.json file, which includes the paths of the related configuration files.
- The Cfg folder should contain the corresponding subfolders.
[Screenshot] - The Paralist folder should contain configuration files, such as ParamList_CN.xml, etc. (Place the configuration files under the Paralist folder according to your specific requirements).
- Add parameter configuration files for different languages as needed. If a corresponding language file is added, place it in the corresponding folder.
[Screenshot]
7. File Integrity Check (First Use)
- Check whether the obtained folder is complete, especially the cfg folder and the paralist folder, as they relate to key functions.
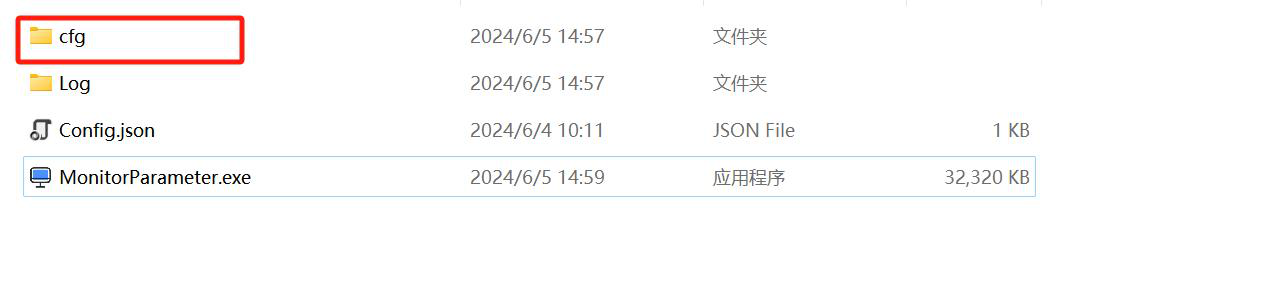
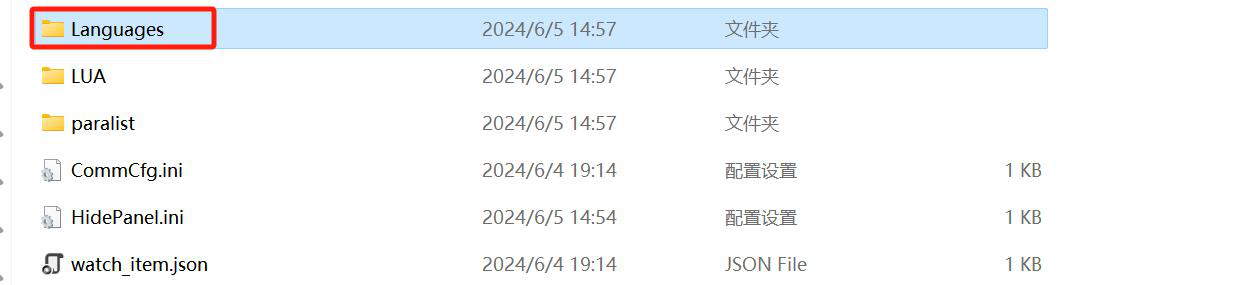
- The Cfg folder should contain the following subfolders
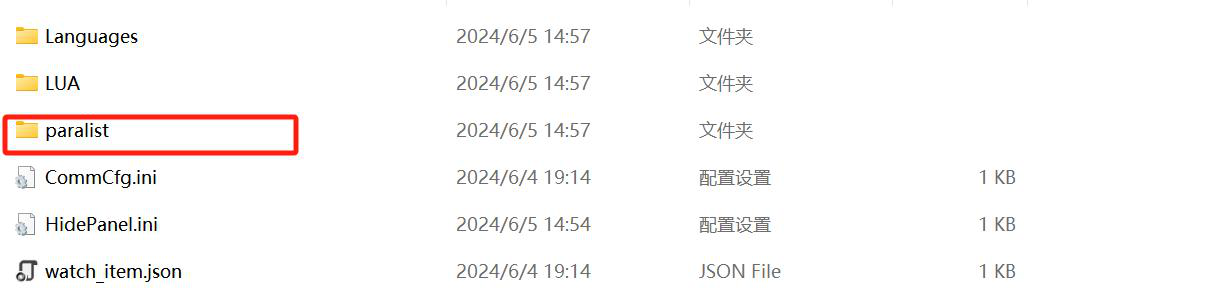
- The paralist folder should contain configuration files, for example as follows (depending on your specific needs, place the configuration files under the Paralist folder)
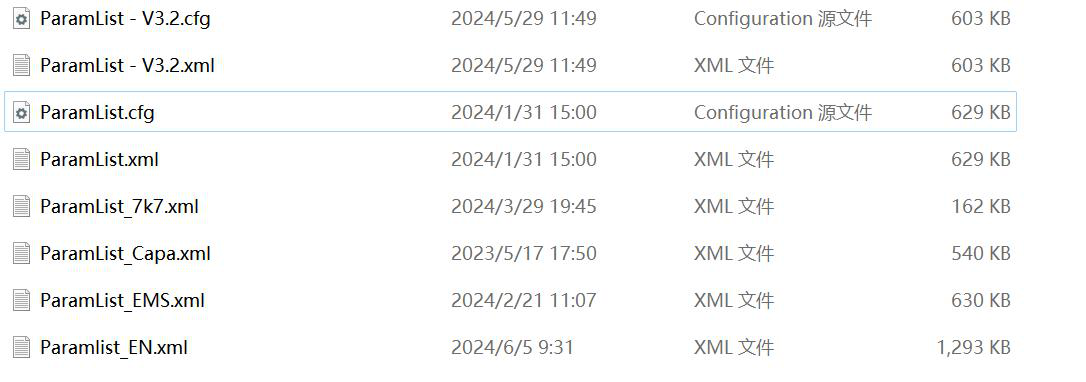
- Add parameter configuration files for different languages as required. If a corresponding language file is added, simply place it in the corresponding folder.
| Check Item | Description |
|---|---|
| Config.json | Software root directory, records the paths of each configuration file |
| cfg folder | Required for key functions; missing it will cause functional abnormalities |
| paralist folder | Stores parameter configuration files (ParamList_CN.xml / ParamList_EN.xml, etc.) |
| Language files | Placed into the corresponding language subfolder as required |
8. INI File Description
8.1 [general] General Configuration
| Key | Example Value | Description |
|---|---|---|
| deviceaddr | 1 | Device address |
| communicationtype | ModbusUart | Communication type. The protocol defaults to ModbusTCP, ModbusUart, or En_Uart; any other input defaults to ModbusTCP |
| timeout | 50 | Receive timeout |
| language | CN | Default language: CN for Chinese, EN for English |
| Delayms | 5 | Inter-frame delay time |
| Logfilefoldermaxsize | 512 | Maximum size of the log folder |
| logfilemaxsize | 20971520 | Maximum size of a single log file |
| configfilename | ParamList_CN.xml | Configuration file opened by default |
| fontgrade | 1 | Font grade: 0 Small, 1 Medium, 2 Large |
8.2 [serialport] Serial Port Configuration
| Key | Example Value | Description |
|---|---|---|
| com | COM5 | Serial port number |
| baud | 9600 | Baud rate |
| parity | N | Parity: N / E / O |
| databits | 8 | Data bits |
| stopbits | 1 | Stop bits |
8.3 [network] Network Configuration
| Key | Example Value | Description |
|---|---|---|
| ip | 192.168.1.200 | IP address |
| port | 502 | Port number |
8.4 Original INI Content Example
Figure: INI Configuration File
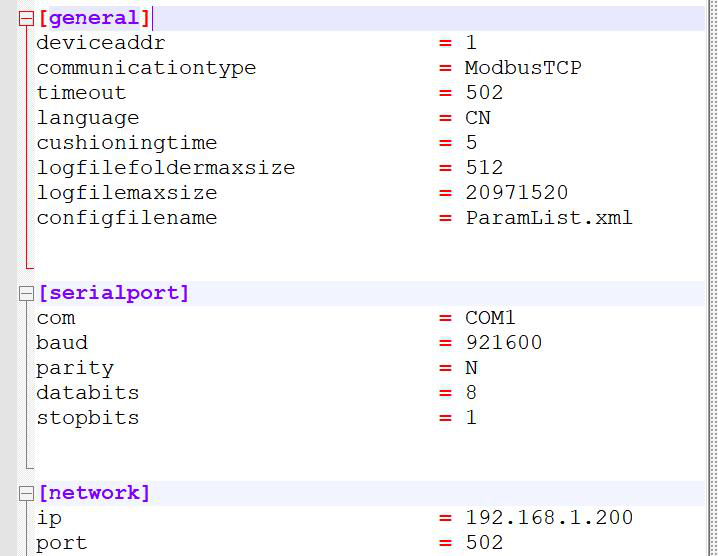
[general]
deviceaddr = 1                     /*Device address*/
communicationtype = ModbusUart     /*Communication mode. Protocol defaults to ModbusTCP, ModbusUart, or En_Uart; any other input defaults to ModbusTCP*/
timeout = 50                       /*Reception timeout*/
language = CN                      /*Default language: CN for Chinese, EN for English*/
Delayms = 5                        /*Inter-frame interval*/
Logfilefoldermaxsize = 512         /*Log folder size*/
logfilemaxsize = 20971520          /*Log file size*/
configfilename = ParamList_CN.xml  /*Default configuration file to open*/
fontgrade = 1                      /*Font grade: 0 small, 1 medium, 2 large*/

[serialport]
com = COM5
baud = 9600
parity = N
databits = 8
stopbits = 1

[network]
ip = 192.168.1.200
port = 502
9. Log File Description
9.1 Communication Log Files
Figure: Communication Log Saving
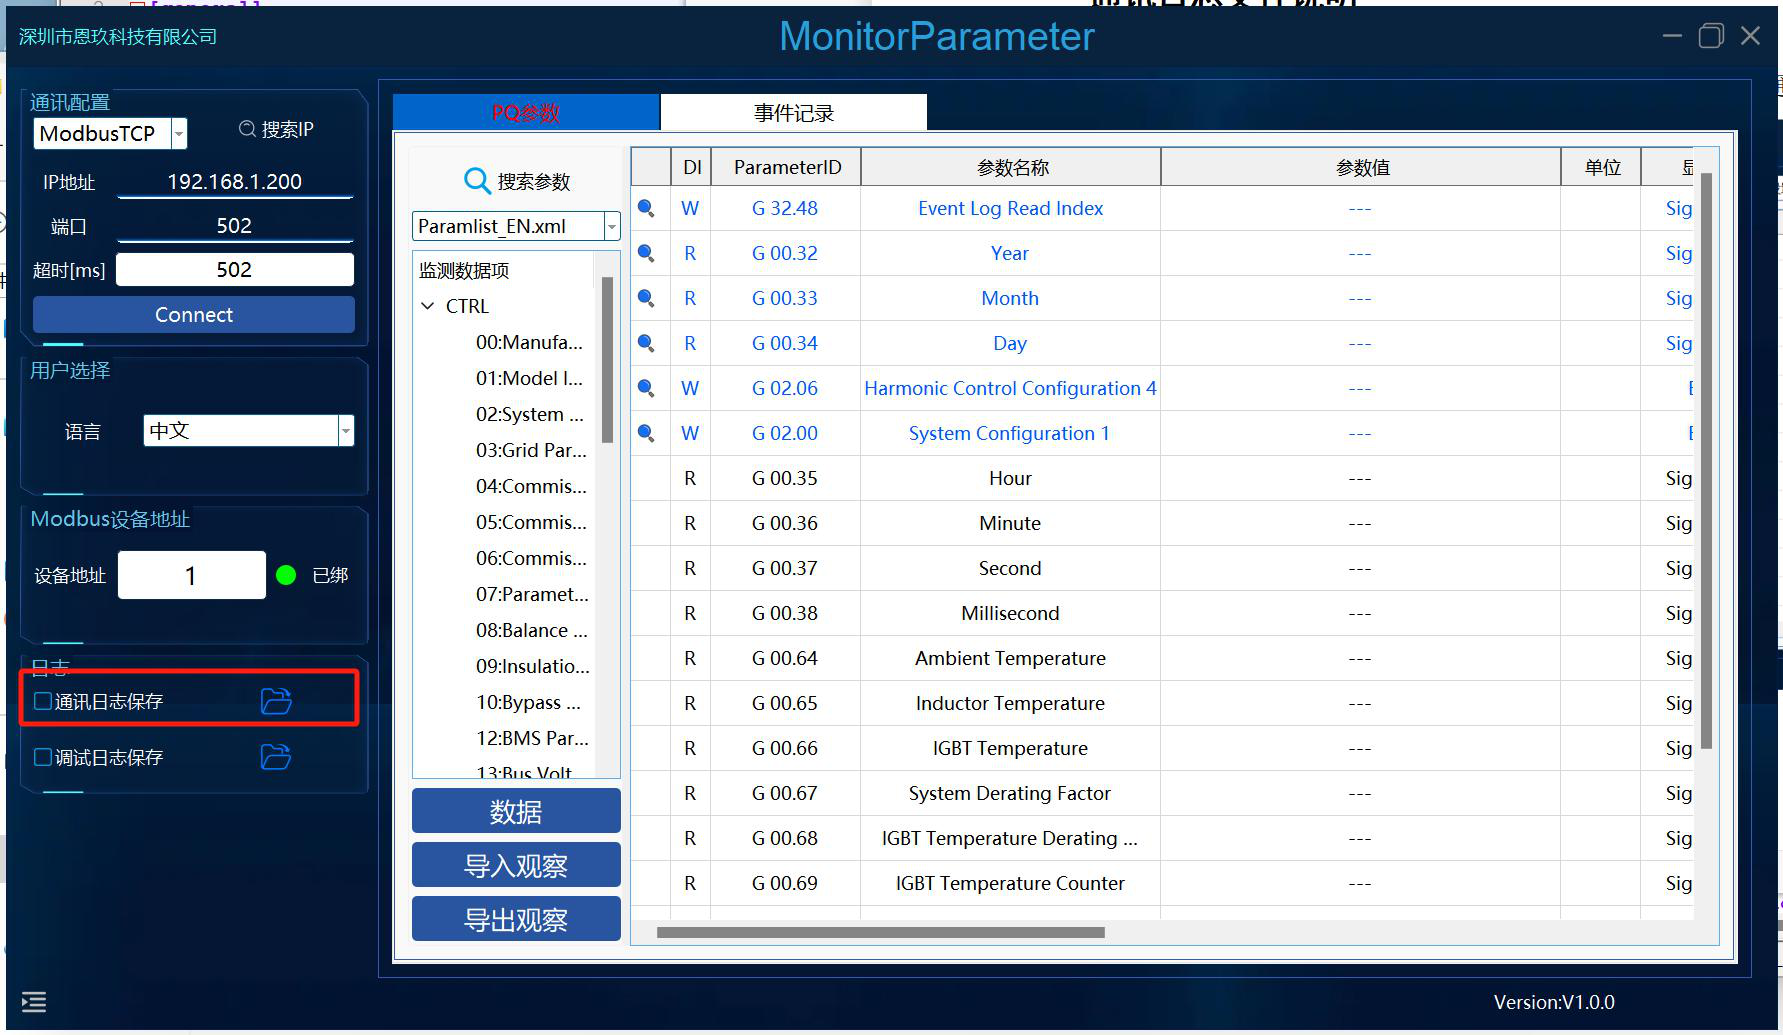
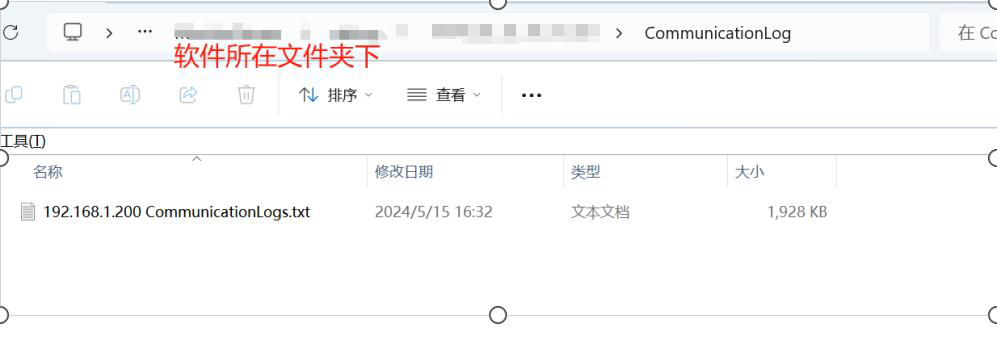
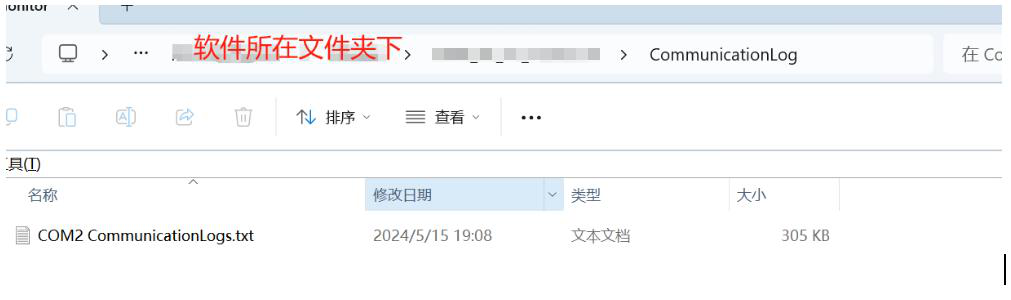

Check the option to save communication logs; the data is saved in the folder where the software is located, as a txt file named after the current communication port. Click the button on the right to automatically open the saved path.
9.2 Debug Log File
Figure: Debug Log Saving
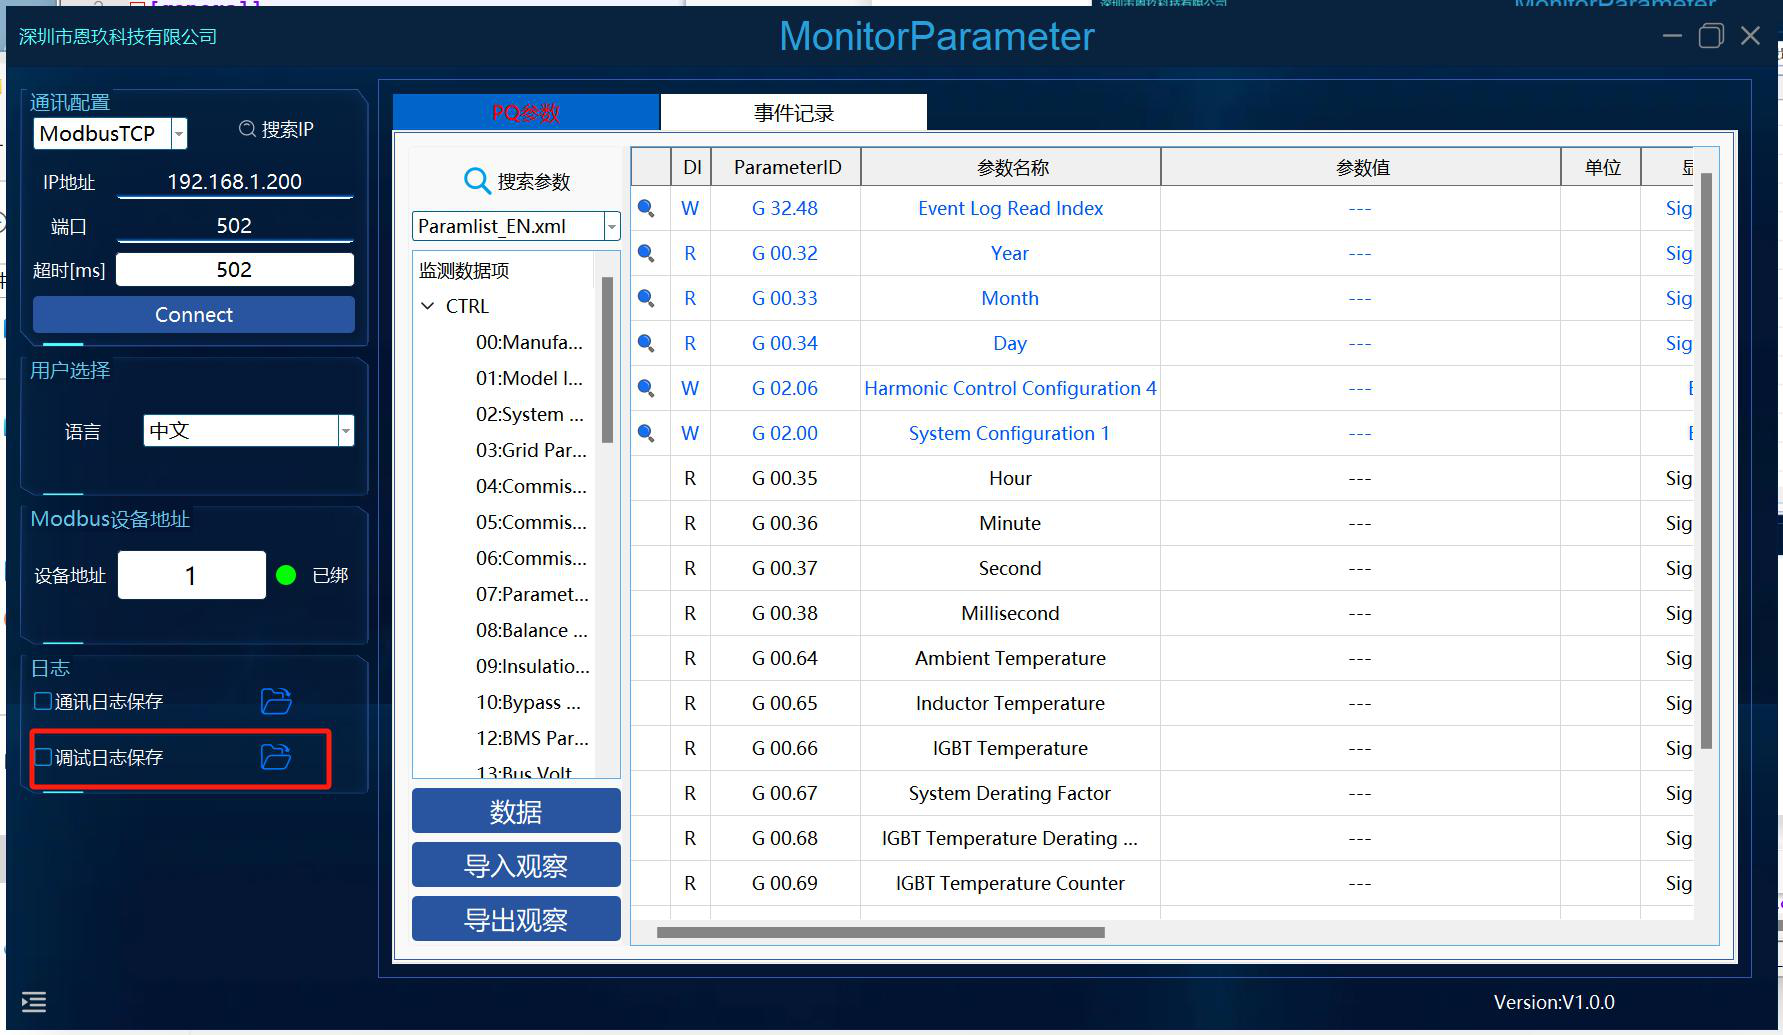
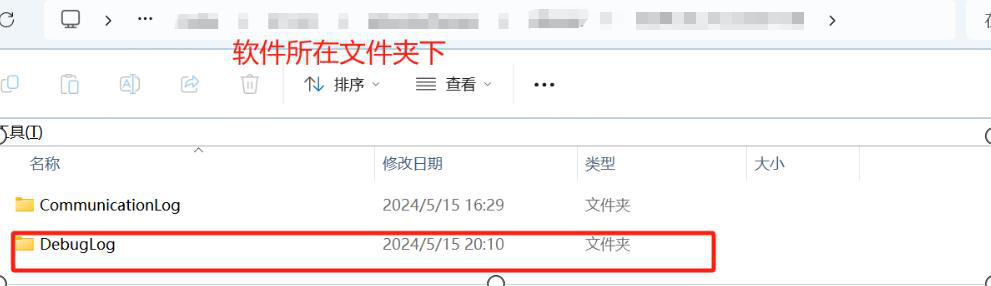
Enable "Debug Log Saving" to save debug logs. This is generally not required.
10. Search IP

Figure: Search Device - Search IP
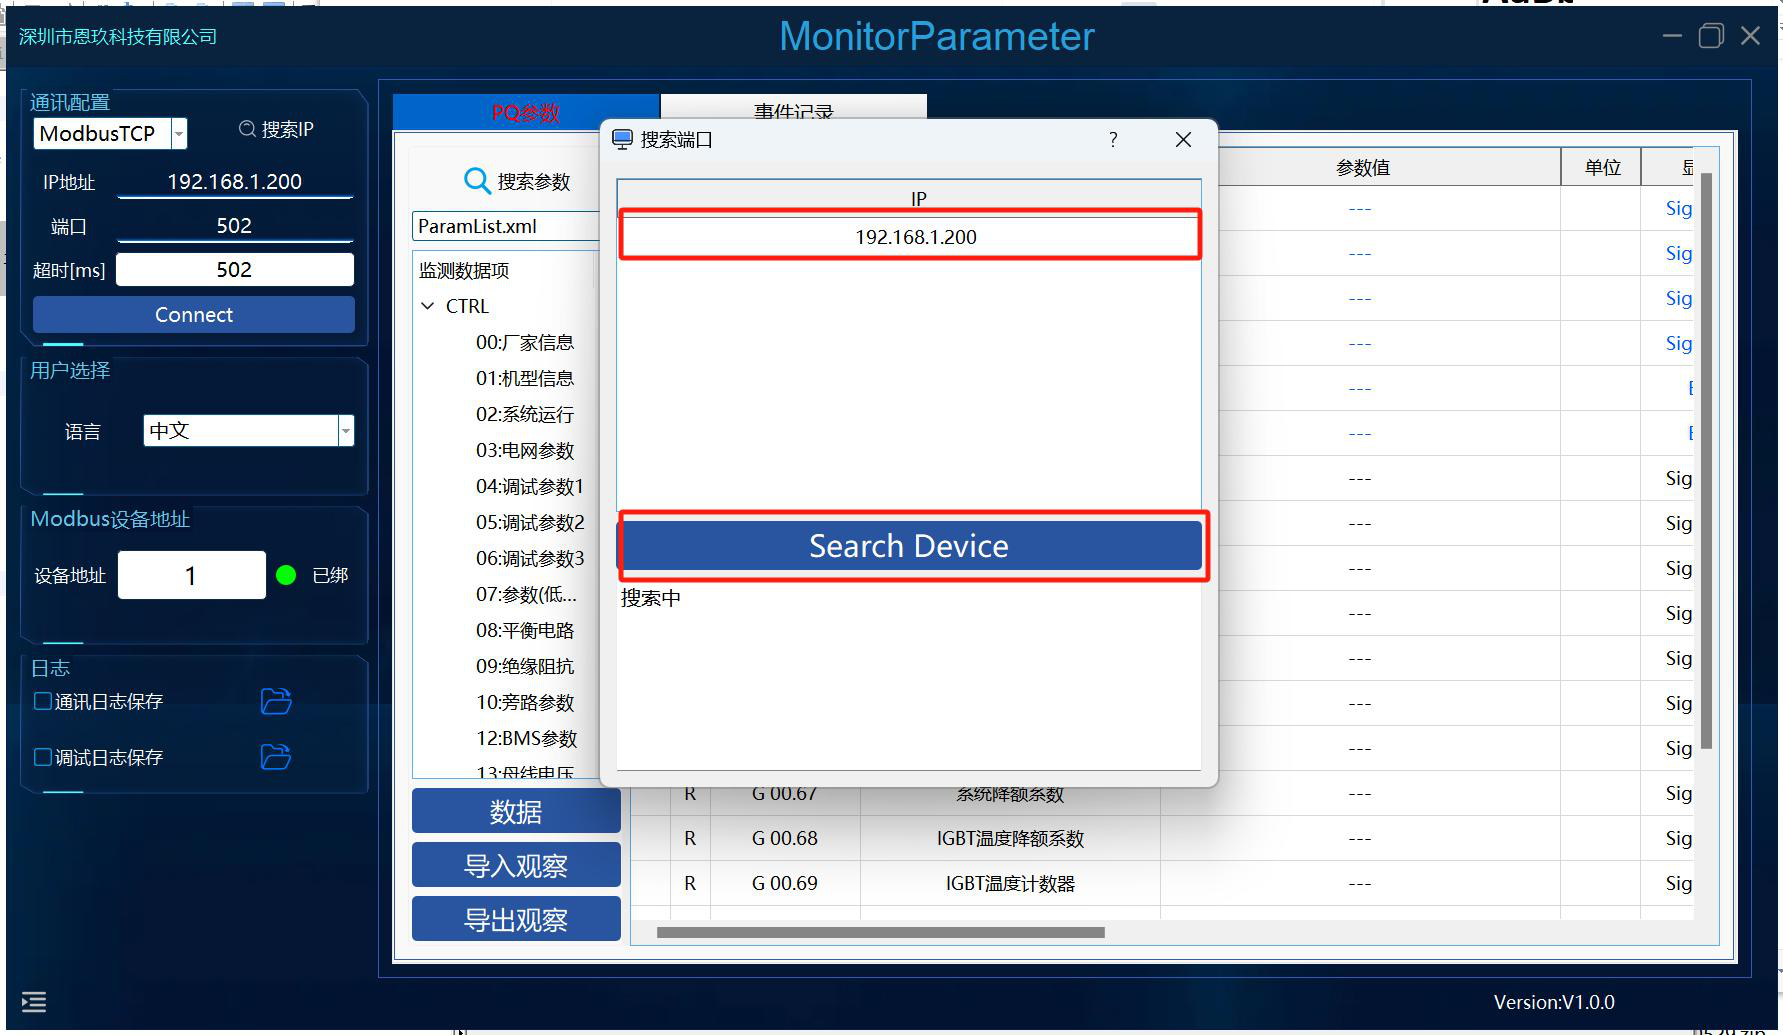
- Click Search Device to search.
- Double-click the target device in the table, and the IP address will be automatically filled in the IP address field.
- Click Connect.
- If no device is found, please open the firewall in the computer properties and allow the application through the firewall.
11. PQ Parameters Page
11.1 Reading Data
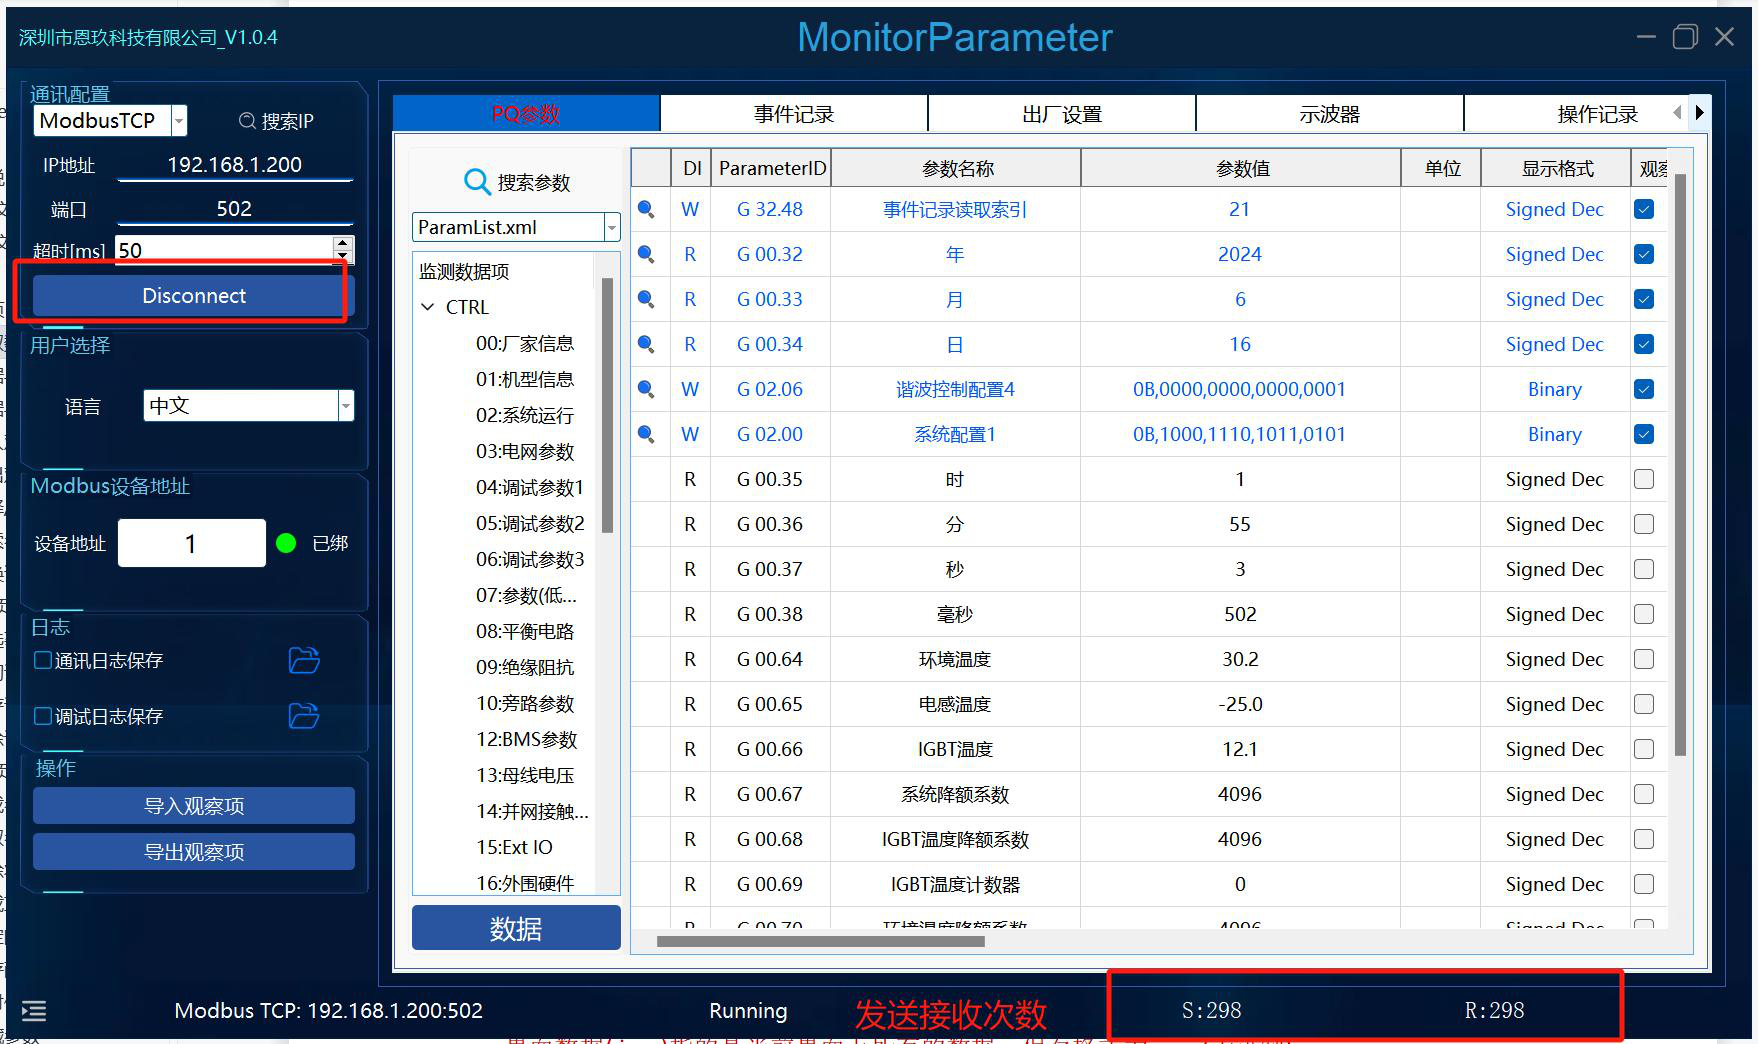
Click Connect to start reading (when the port is functioning normally); click Disconnect to stop reading.
11.2 Data Export
Figure: PQ Parameter Export
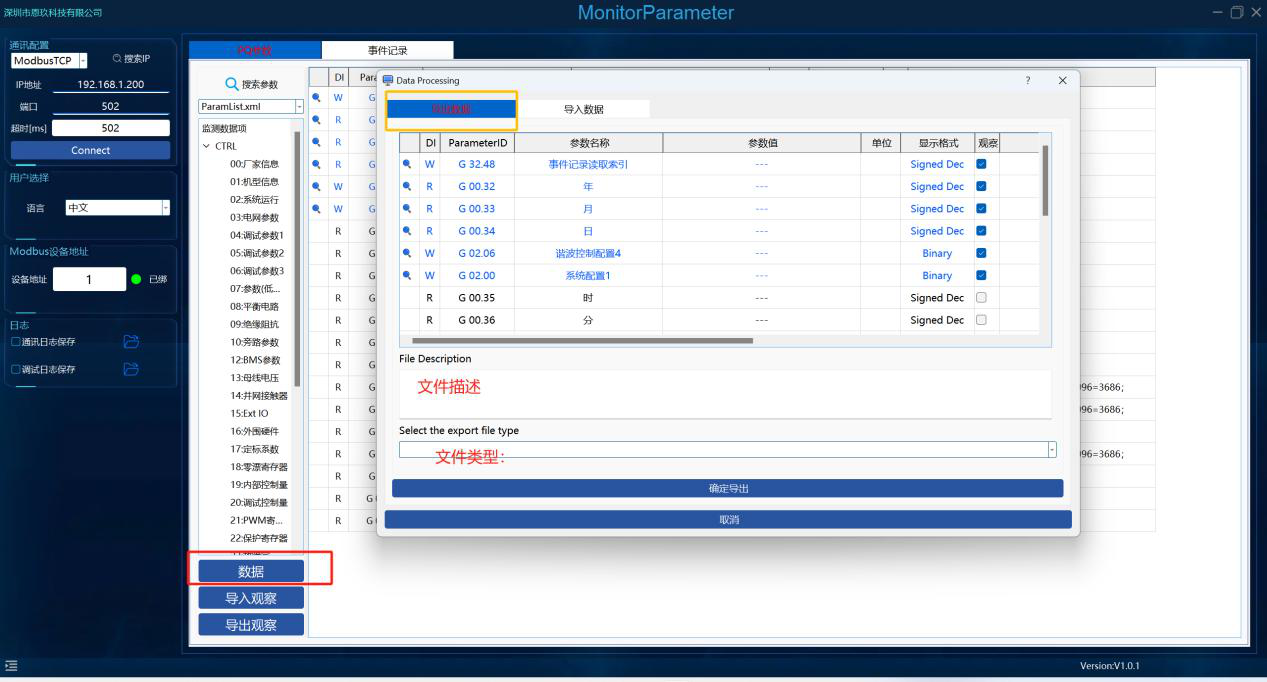
Click the popup, select the export file type, enter the file description, select the file path, and confirm to export.
| File Type | Content | Format |
|---|---|---|
| Interface Data (.csv) | All data on the current interface | csv |
| Interface Data (.json) | All data on the current interface | json (decimal) |
| Observation Configuration Data (.json) | Data of the currently observed items | json (hexadecimal) |
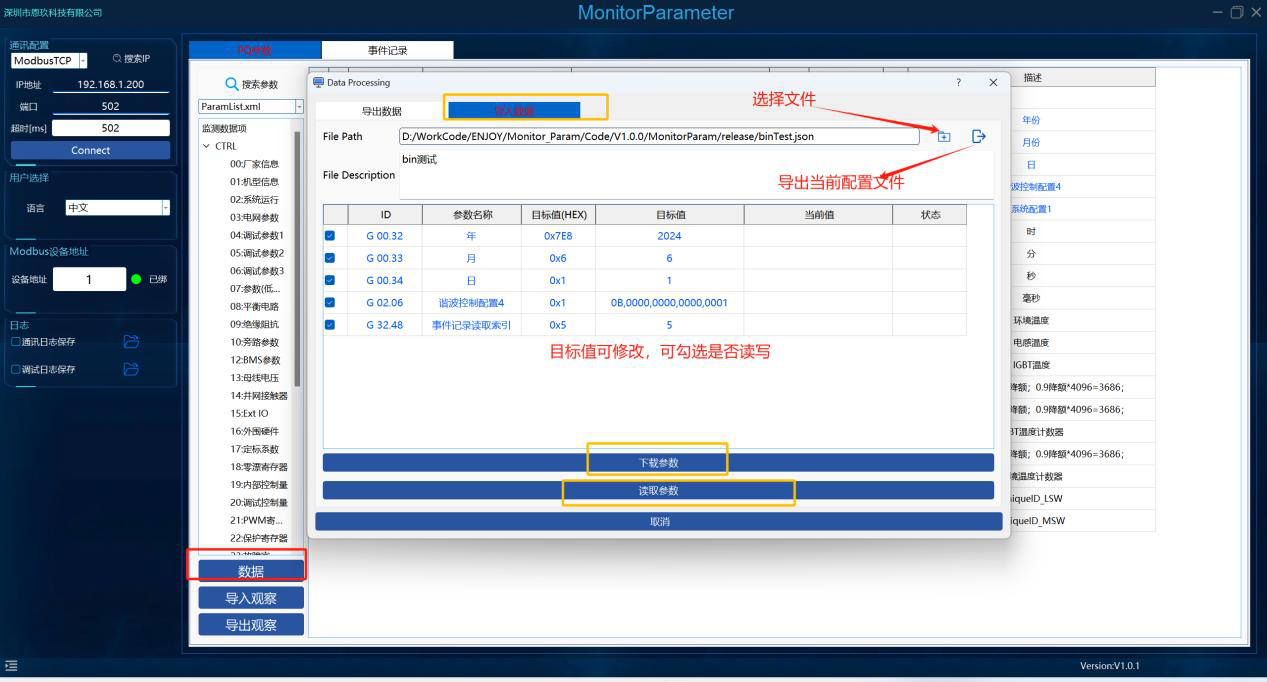
Observation configuration data can be used to import data.
11.3 Data Import
Figure: PQ Parameter Import and Download
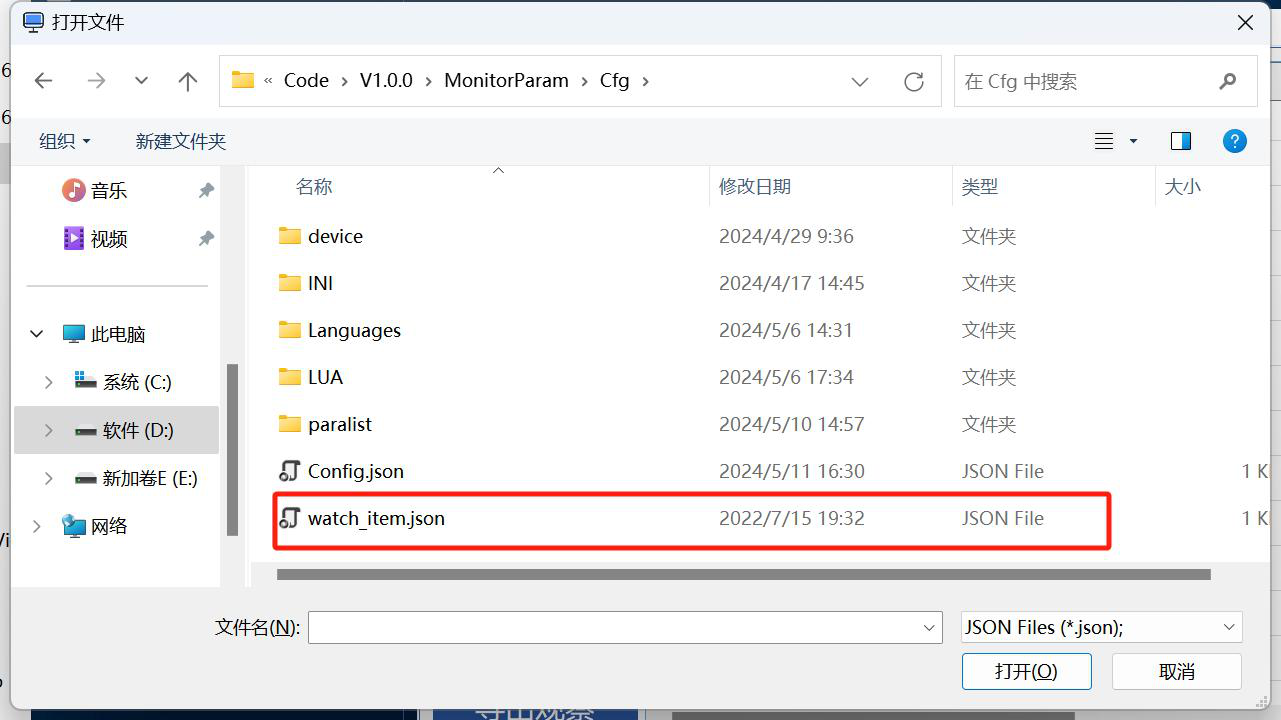
- Click Data → Import Data.
- Select the configuration file (the file is the "Observation Configuration Data (.json)" file in the exported data).
- The table is editable; you can check whether to read or write, and export the current configuration file.
- After confirming, click Download Parameters.
11.4 Import Observations
Select a valid observation data file and open it.
11.5 Export Observations
Figure: Export Observations
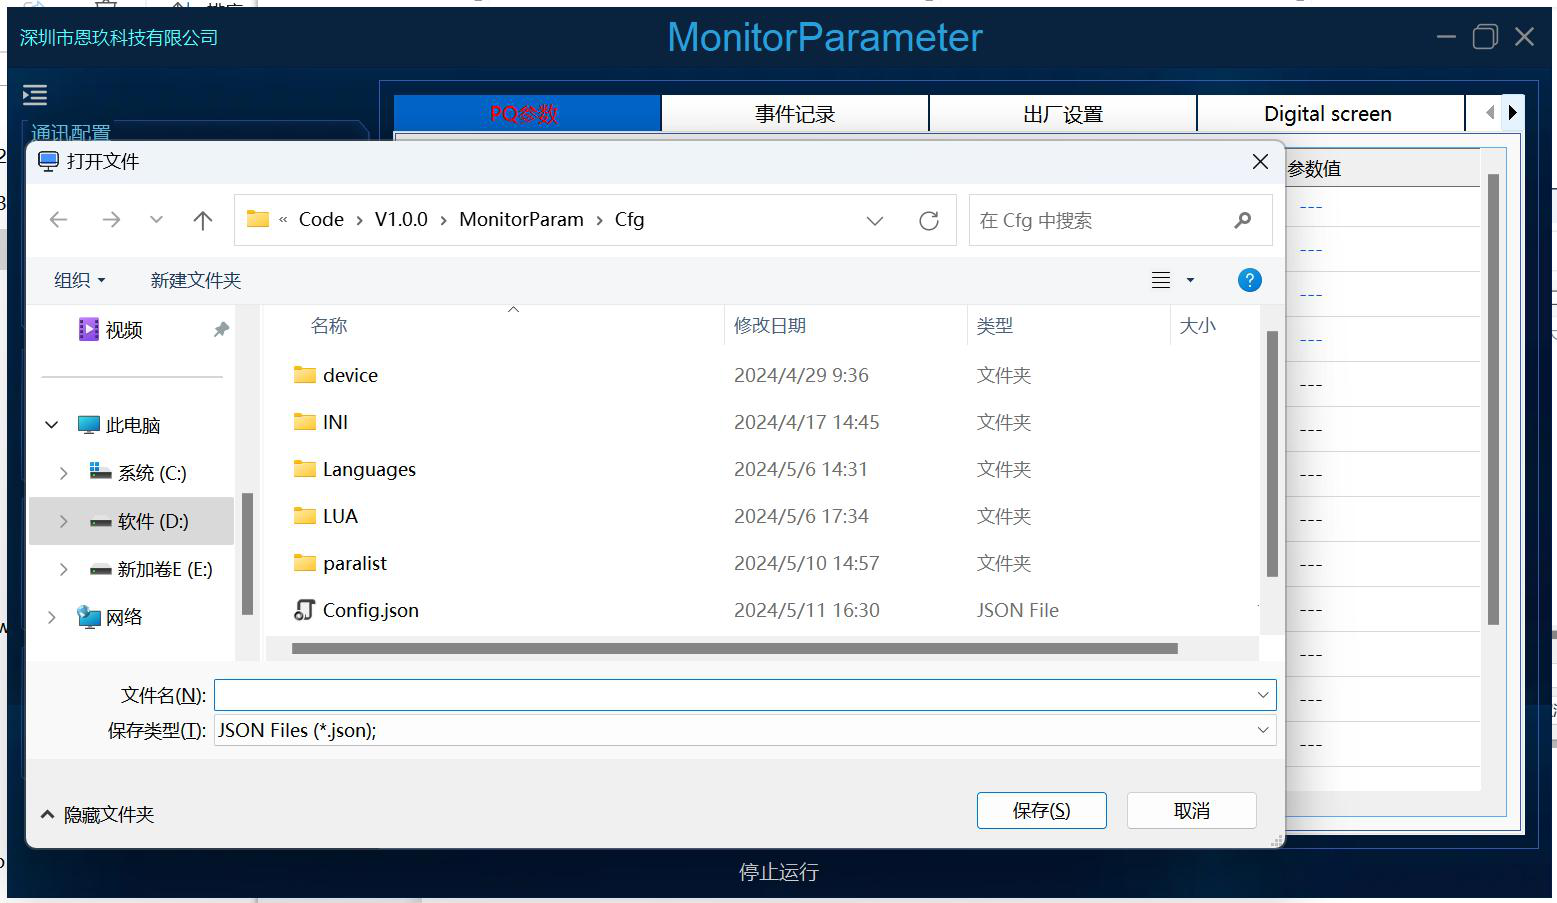
Save the observation data of the current interface, which can be imported as observation data for next use.
11.6 Select/Switch Configuration Profile
Figure: Switch Configuration Profile
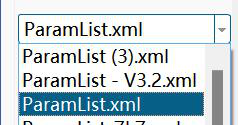
Switch the configuration profile and select your own configuration profile.
11.7 Search Parameters
Figure: Search Parameters
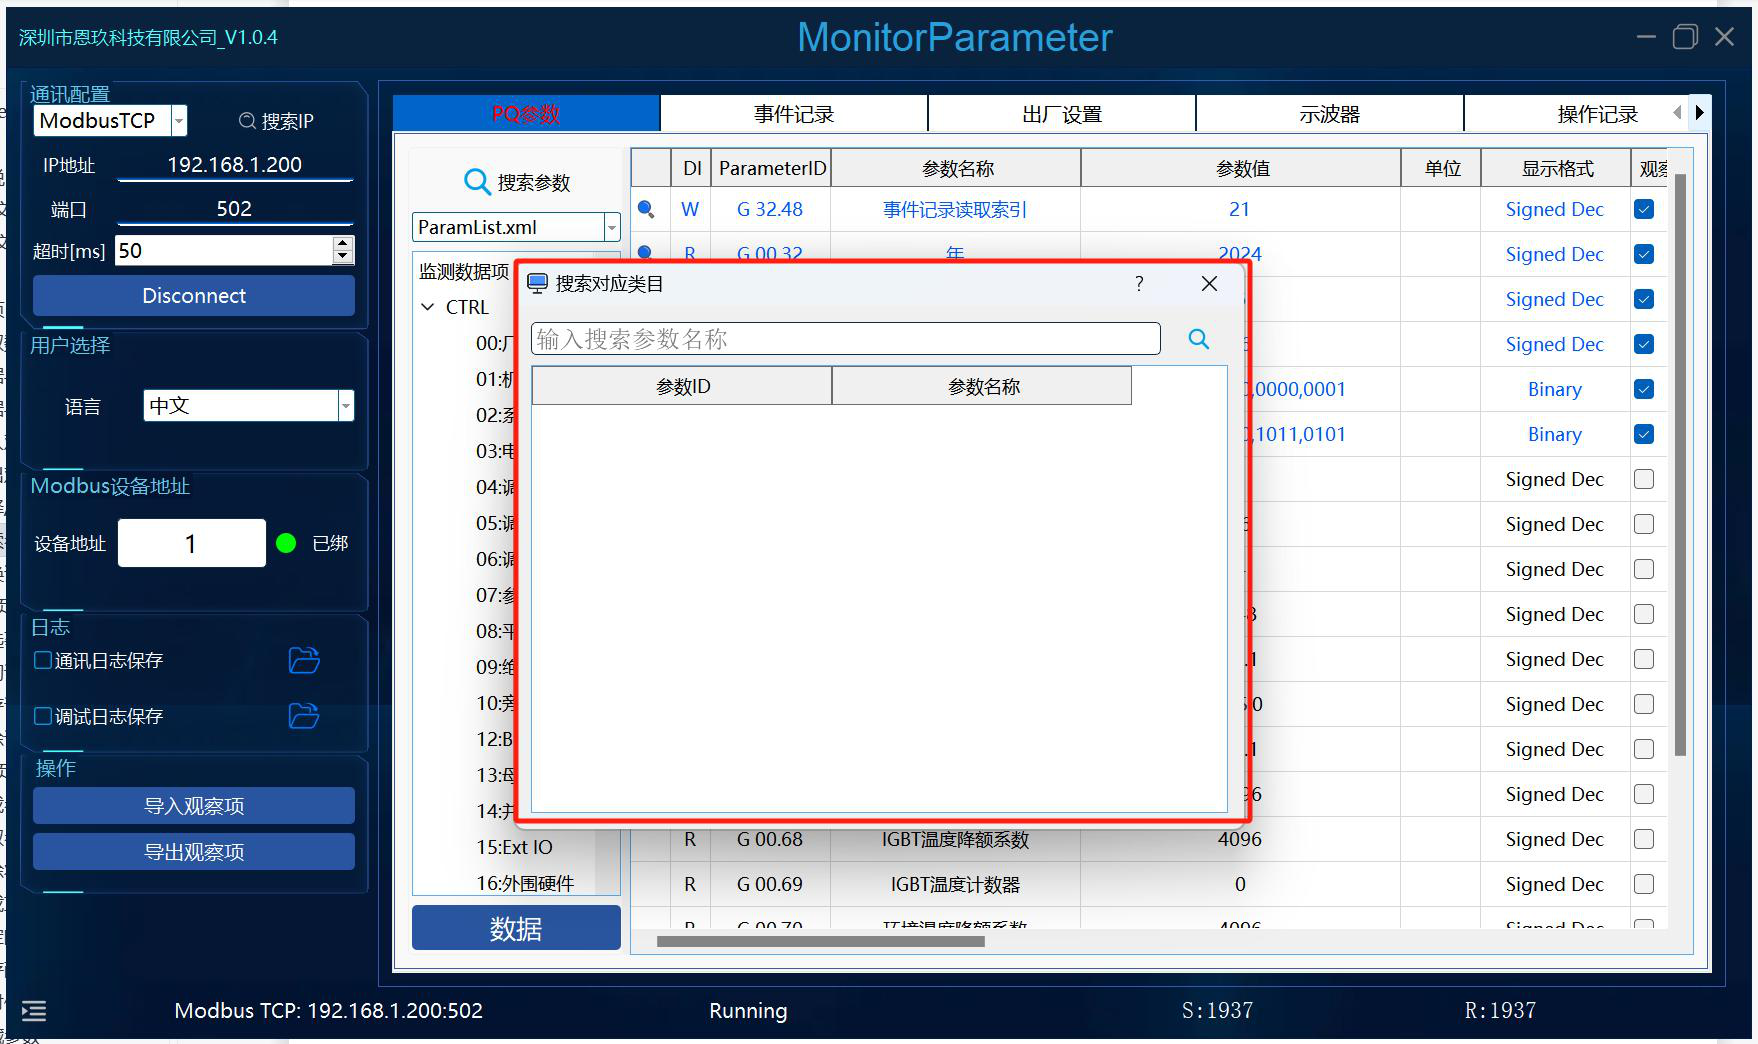
Click Search Parameters, enter the search content, click the search button or press Enter, and right-click to add to the watchlist.
11.8 Switching Language
Figure: Switching Language and Configuration File
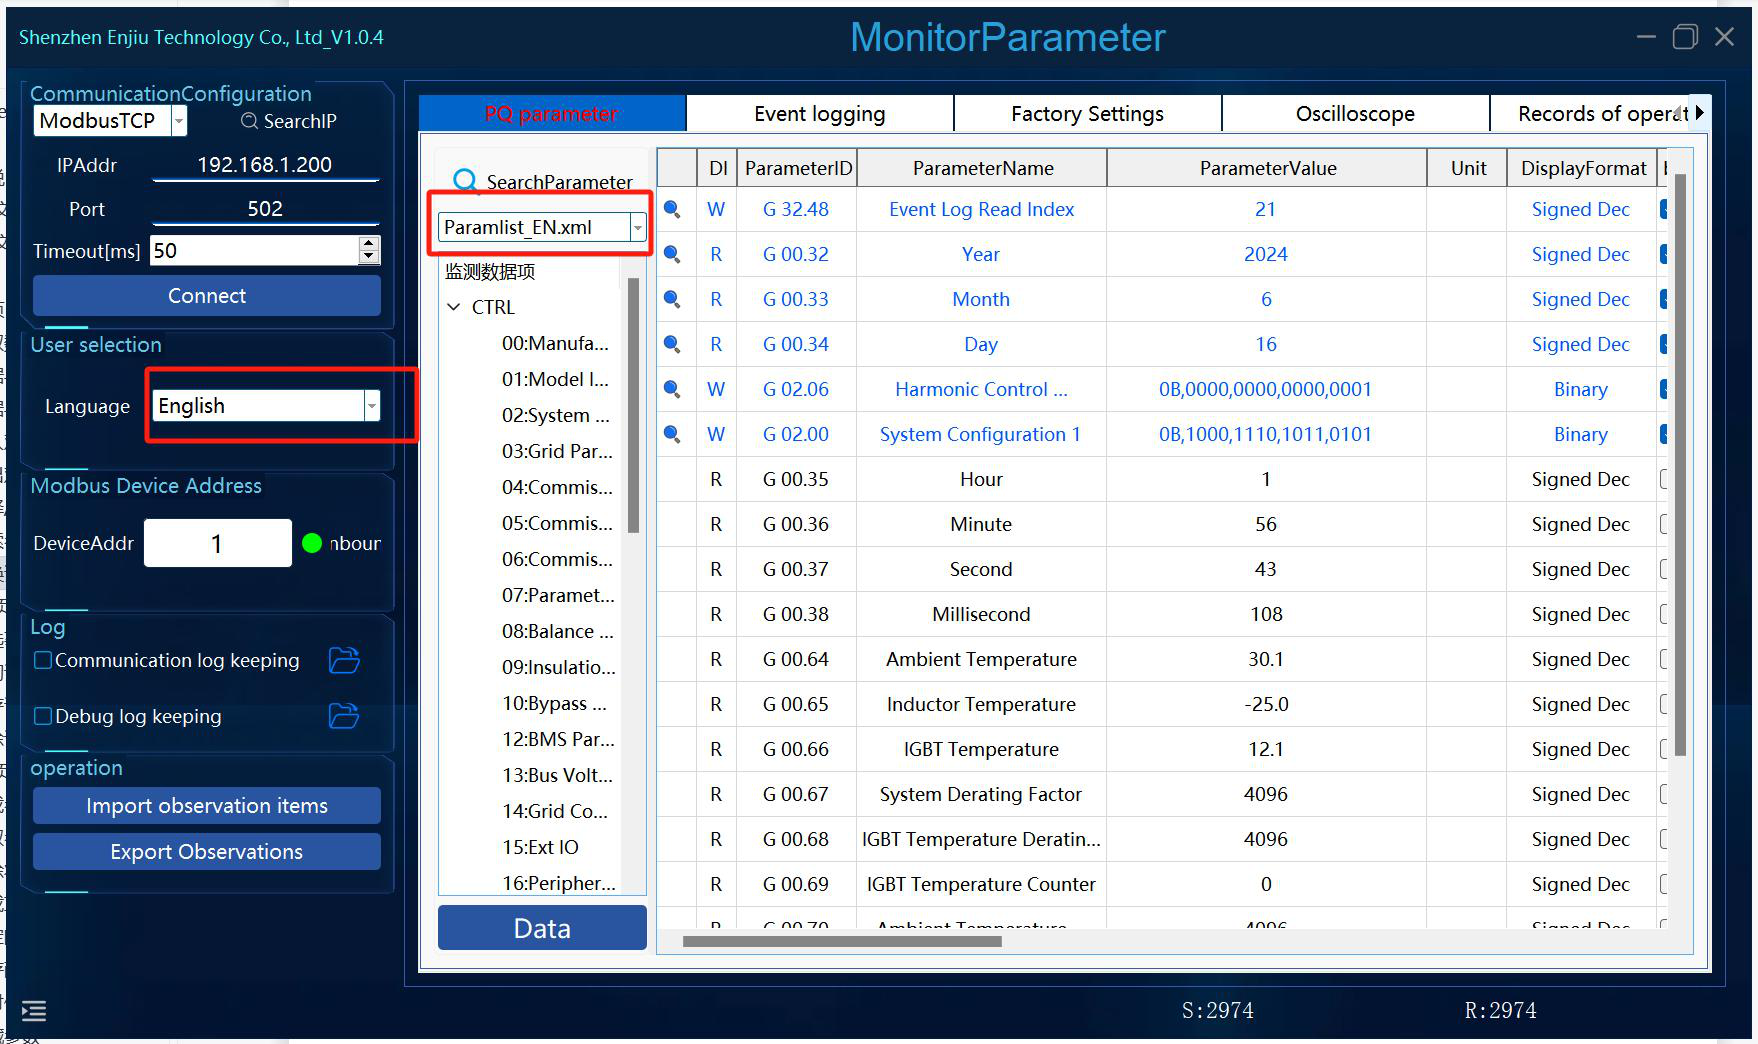
After switching the language, you need to manually switch the XML configuration file: Paramlist_EN.xml is the English version of Paramlist.xml.
12. Event Log Page
Figure: Event Log Page Operations
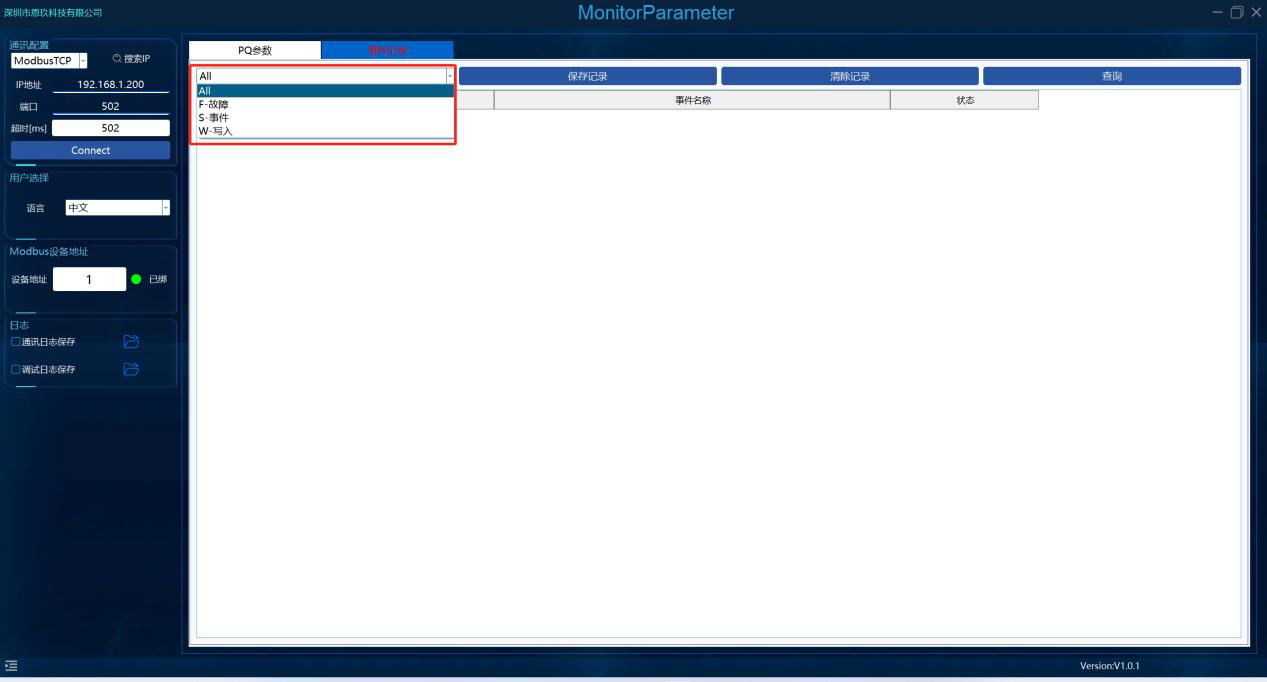
- Filter Event Type: Filter by event type.
- Query Records: Query the records of the existing entry count.
- Save Records: Save the event records to the specified location.
- Clear Records: Clear the event records.
13. Factory Settings Page
13.1 Downloading Parameters
Select the parameter configuration, or choose a file from the drop-down box, and check the parameters that need to be downloaded.
13.2 Read Parameters
Figure: Factory Settings: Download/Read Parameters
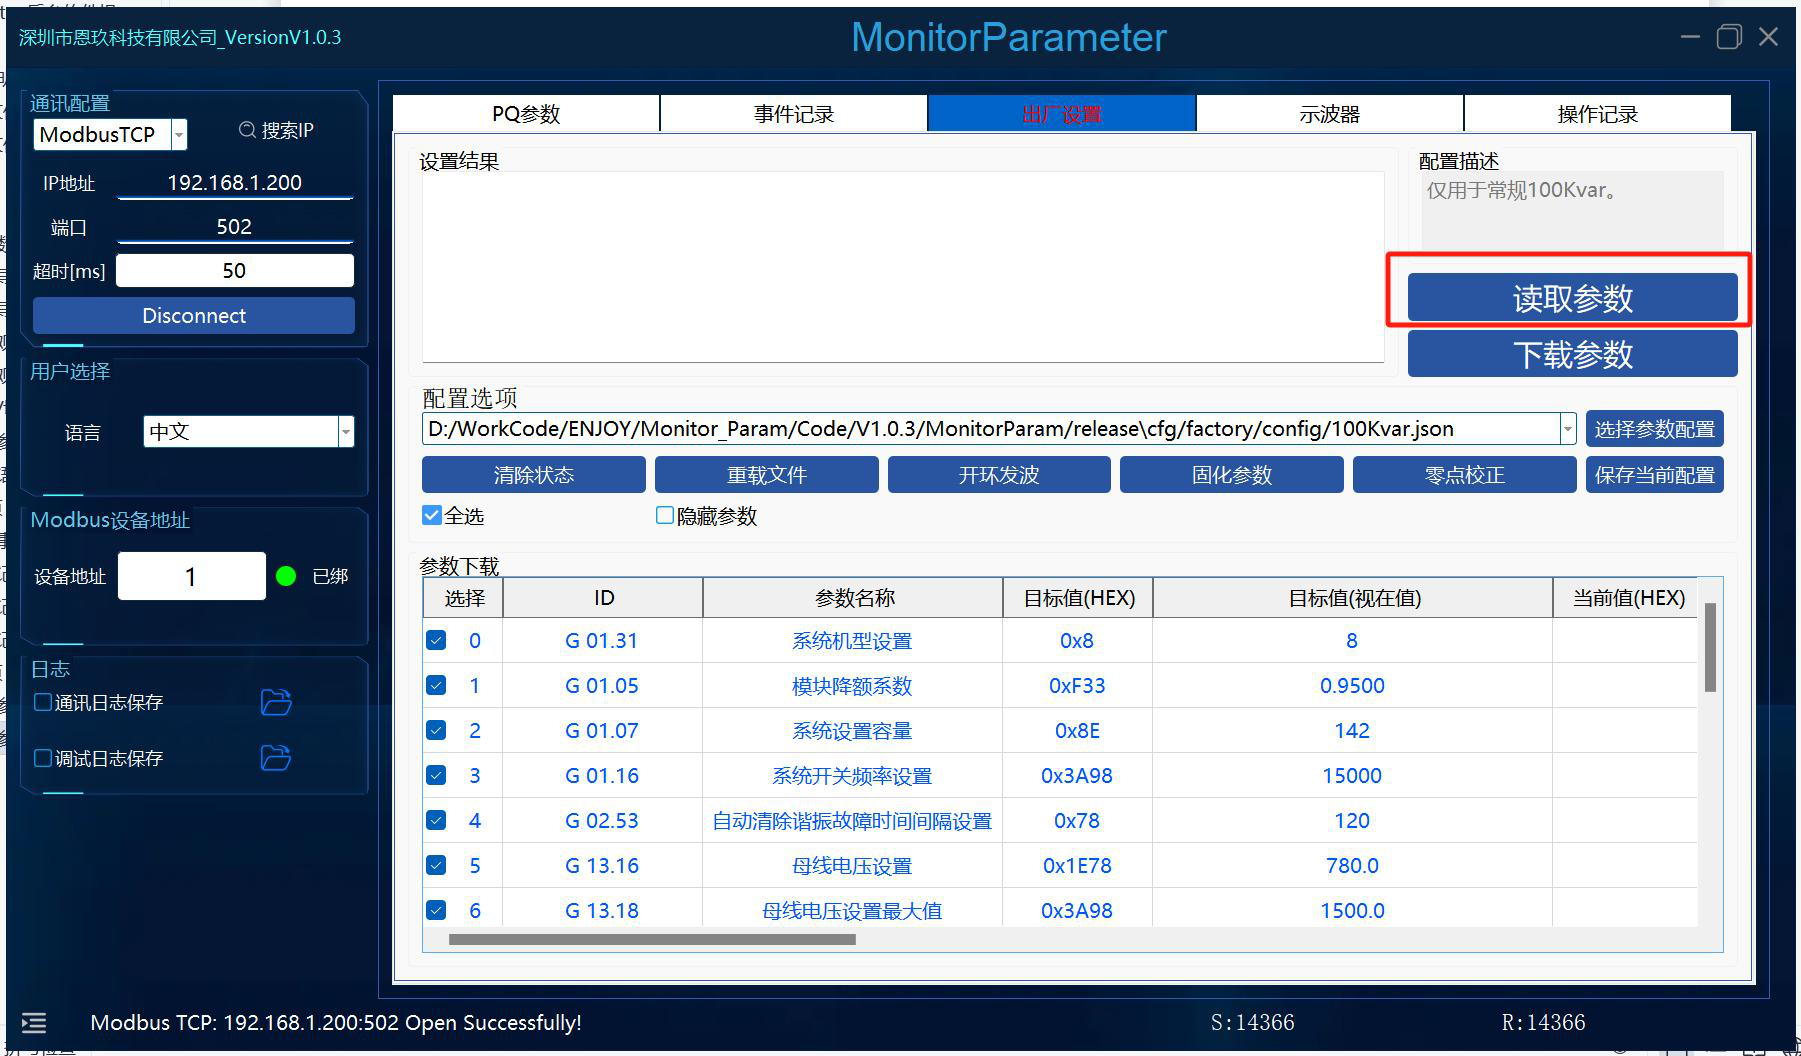
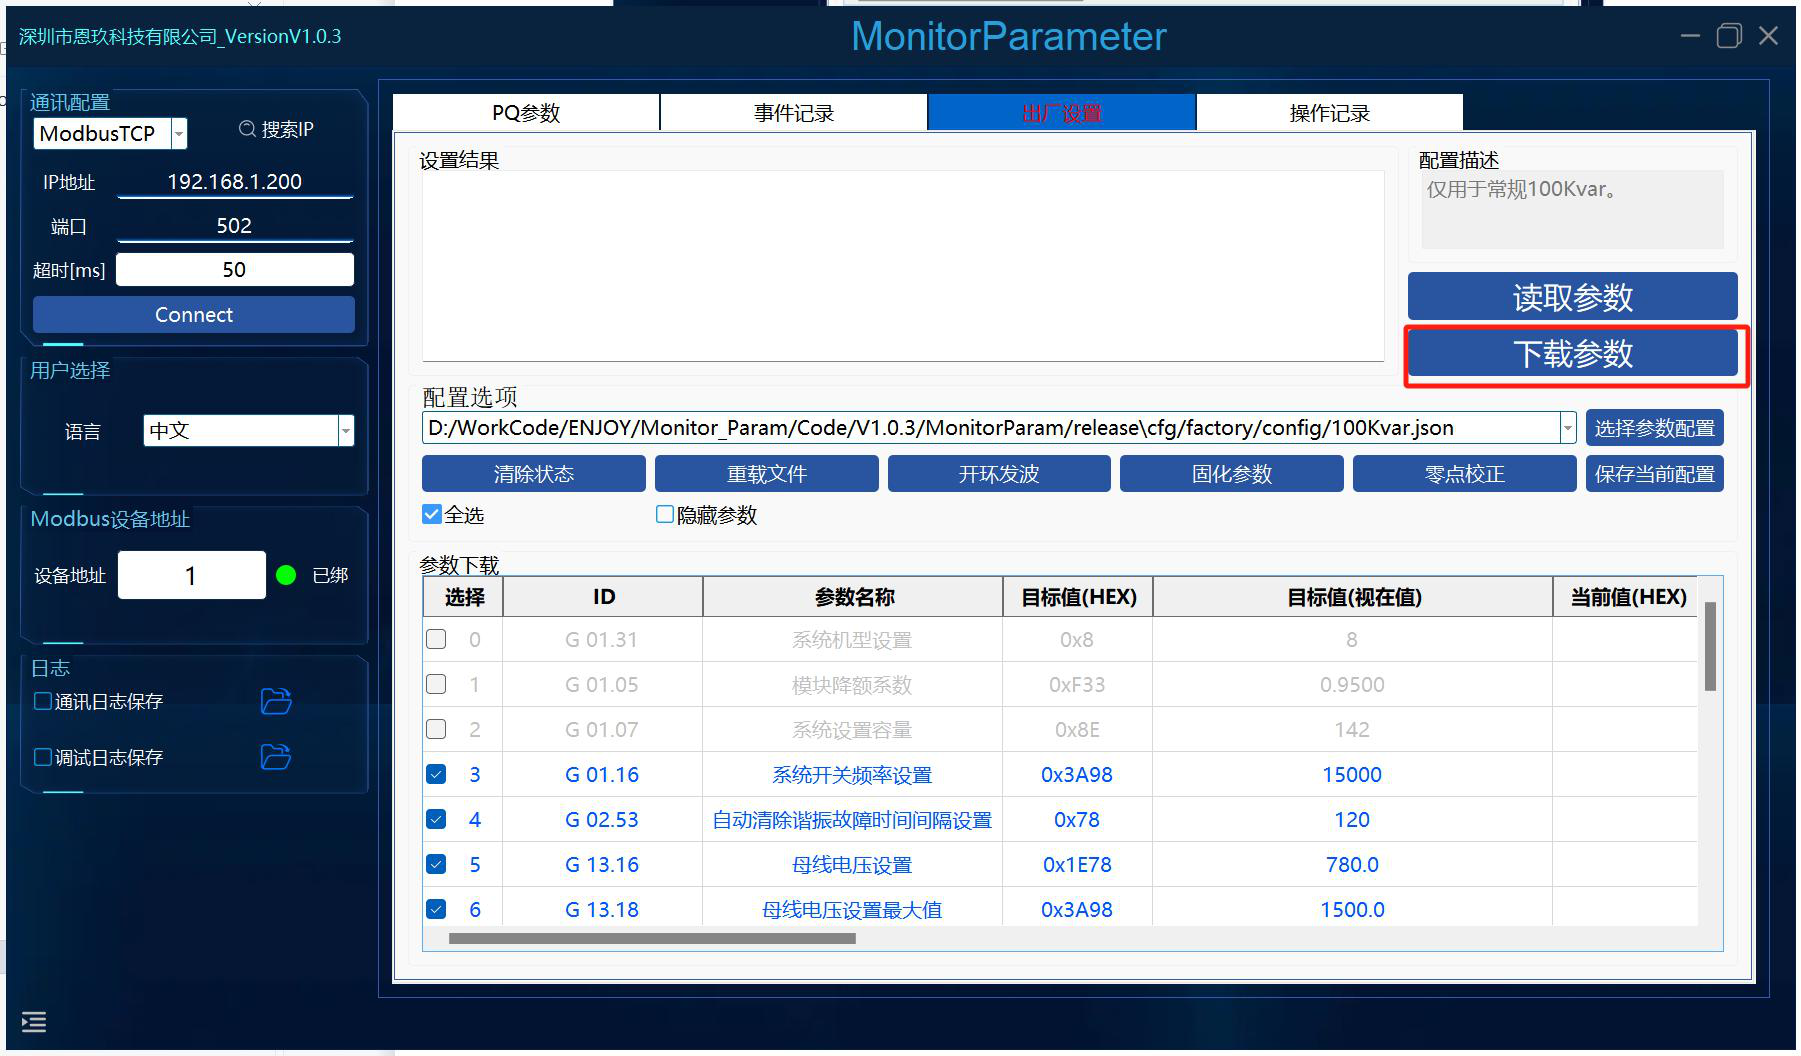
Select and check the rows you want to read, then click Read Parameters.
13.3 Clear Status
Clear the status bar in the settings result display box and the table.
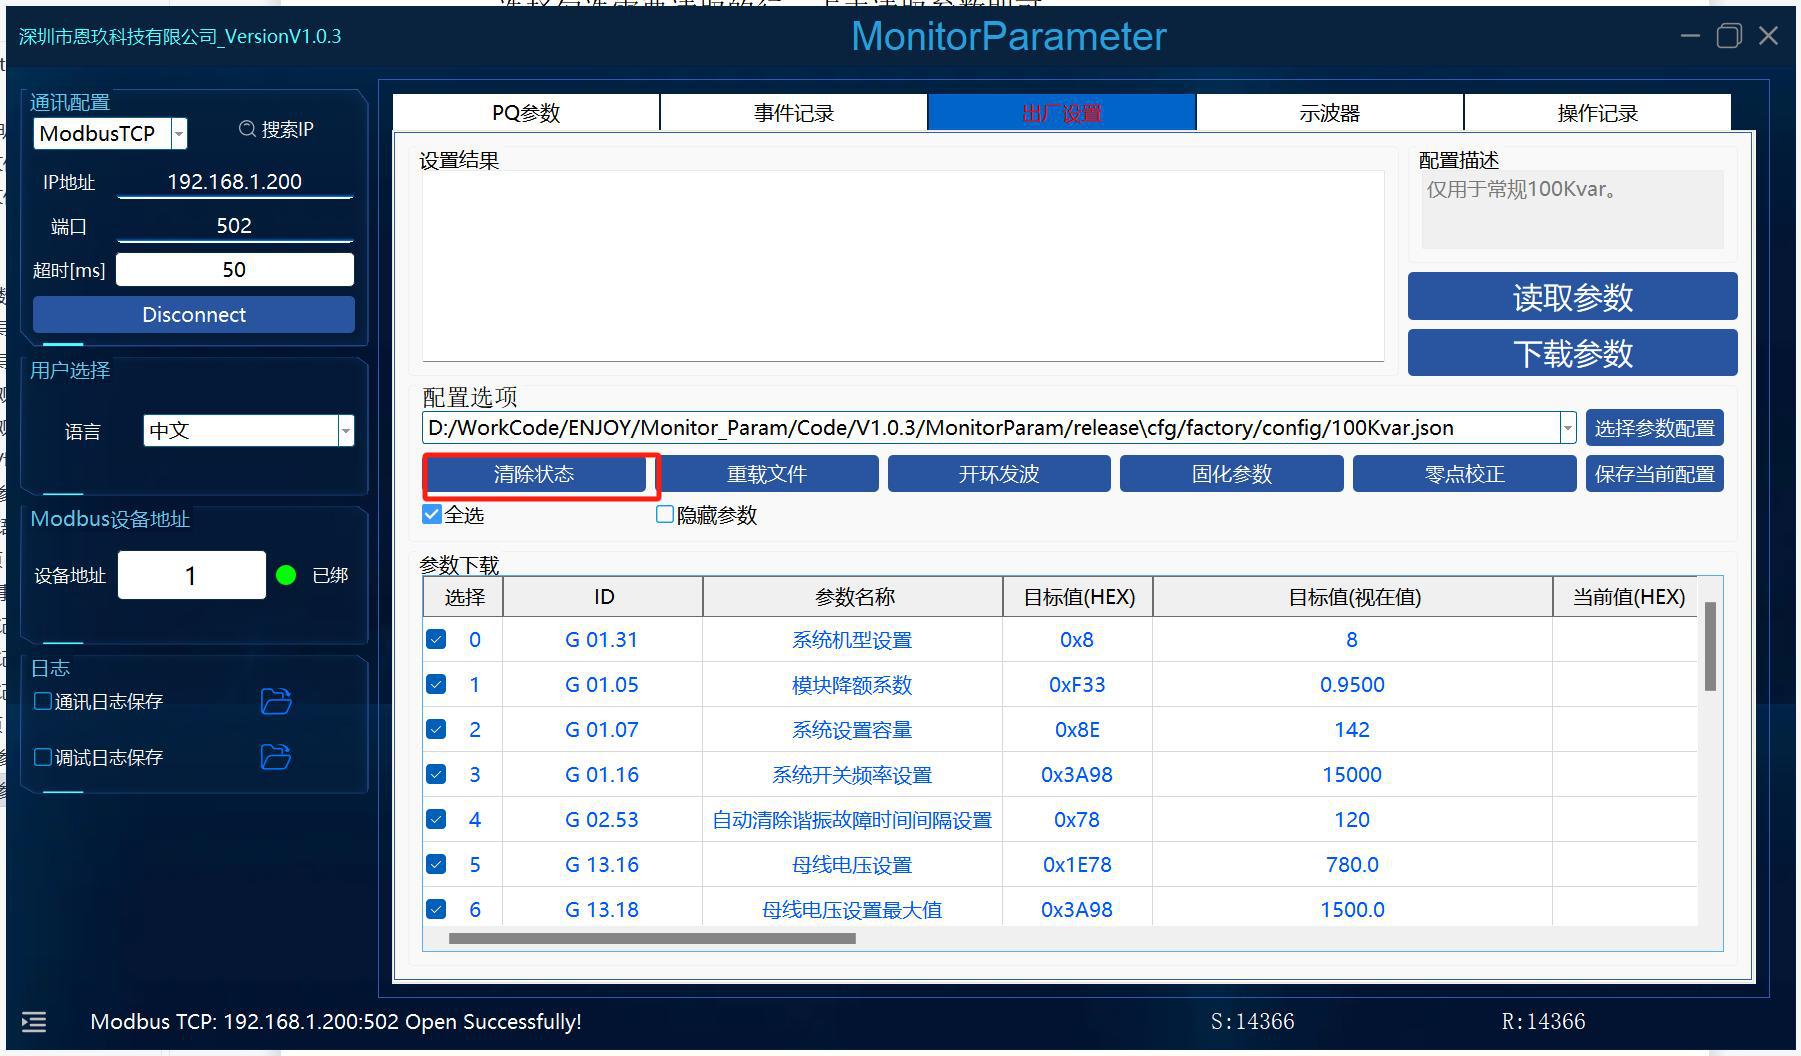
13.4 Reload File
Figure: Reload File and Clear State
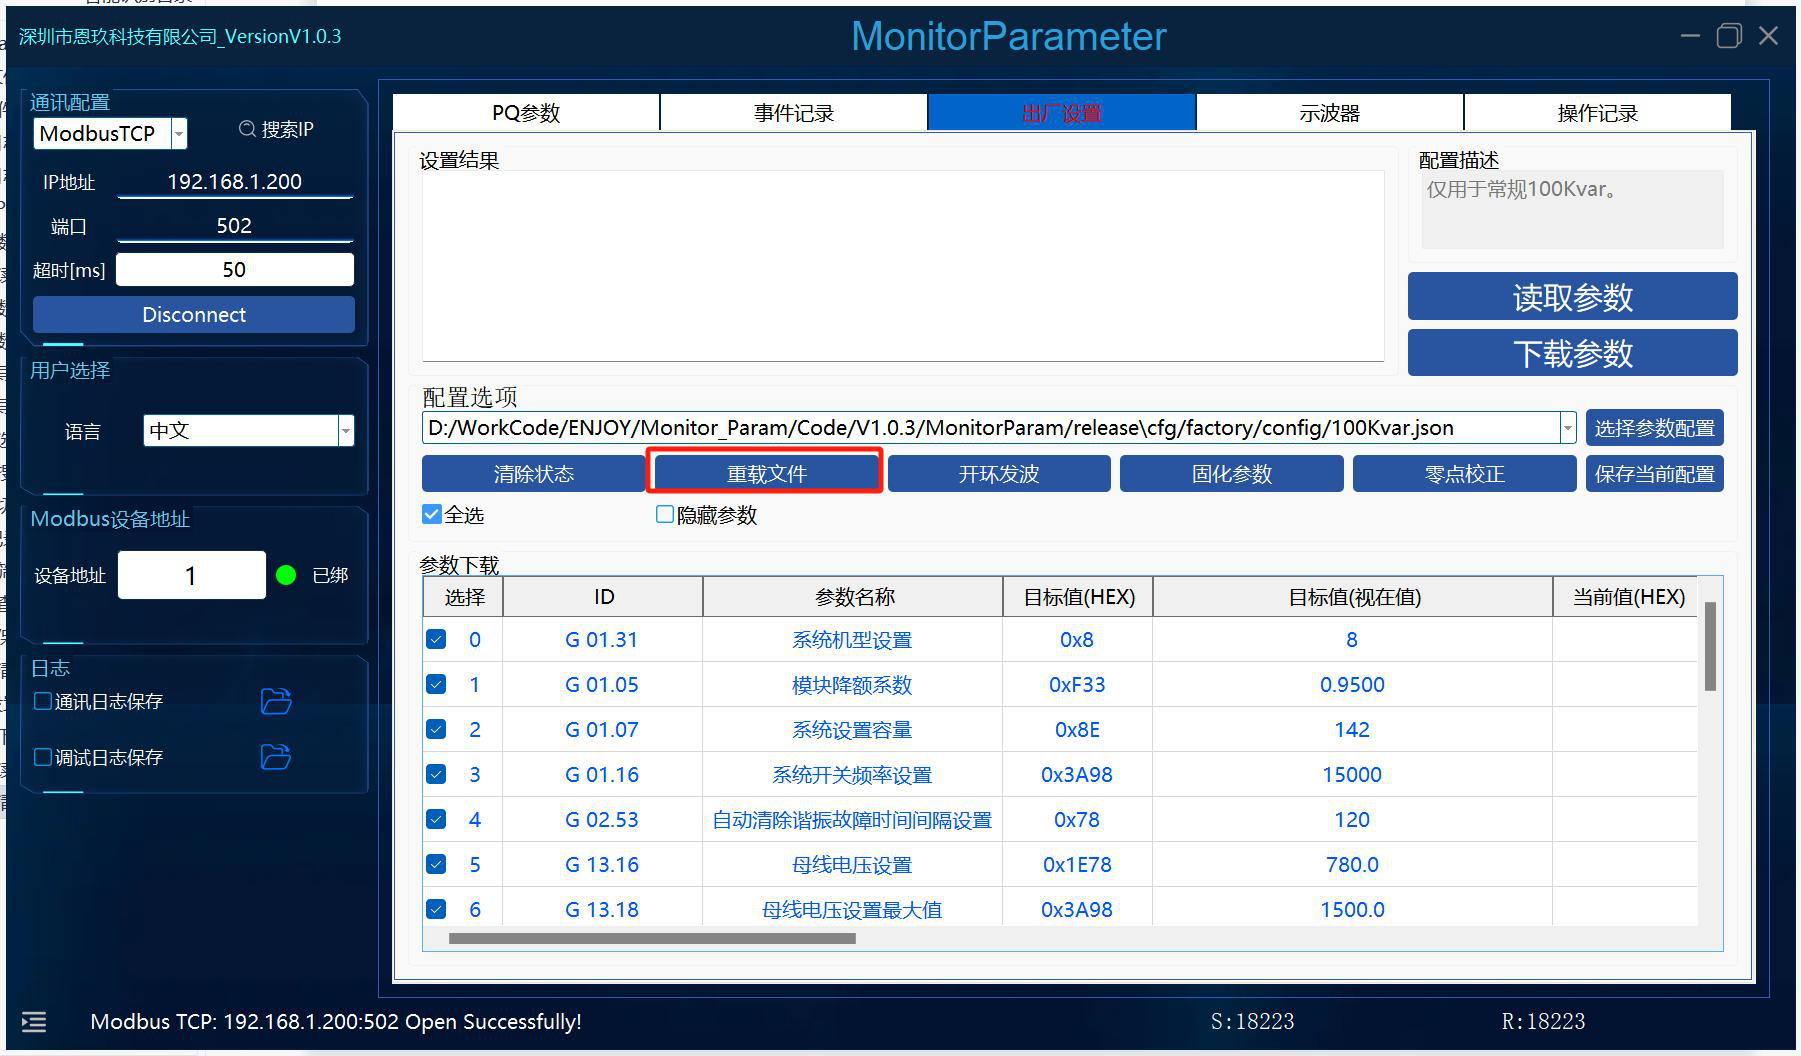
Reload the selected file.
13.5 Specified Commands
Figure: Specified Command and Saving Configuration
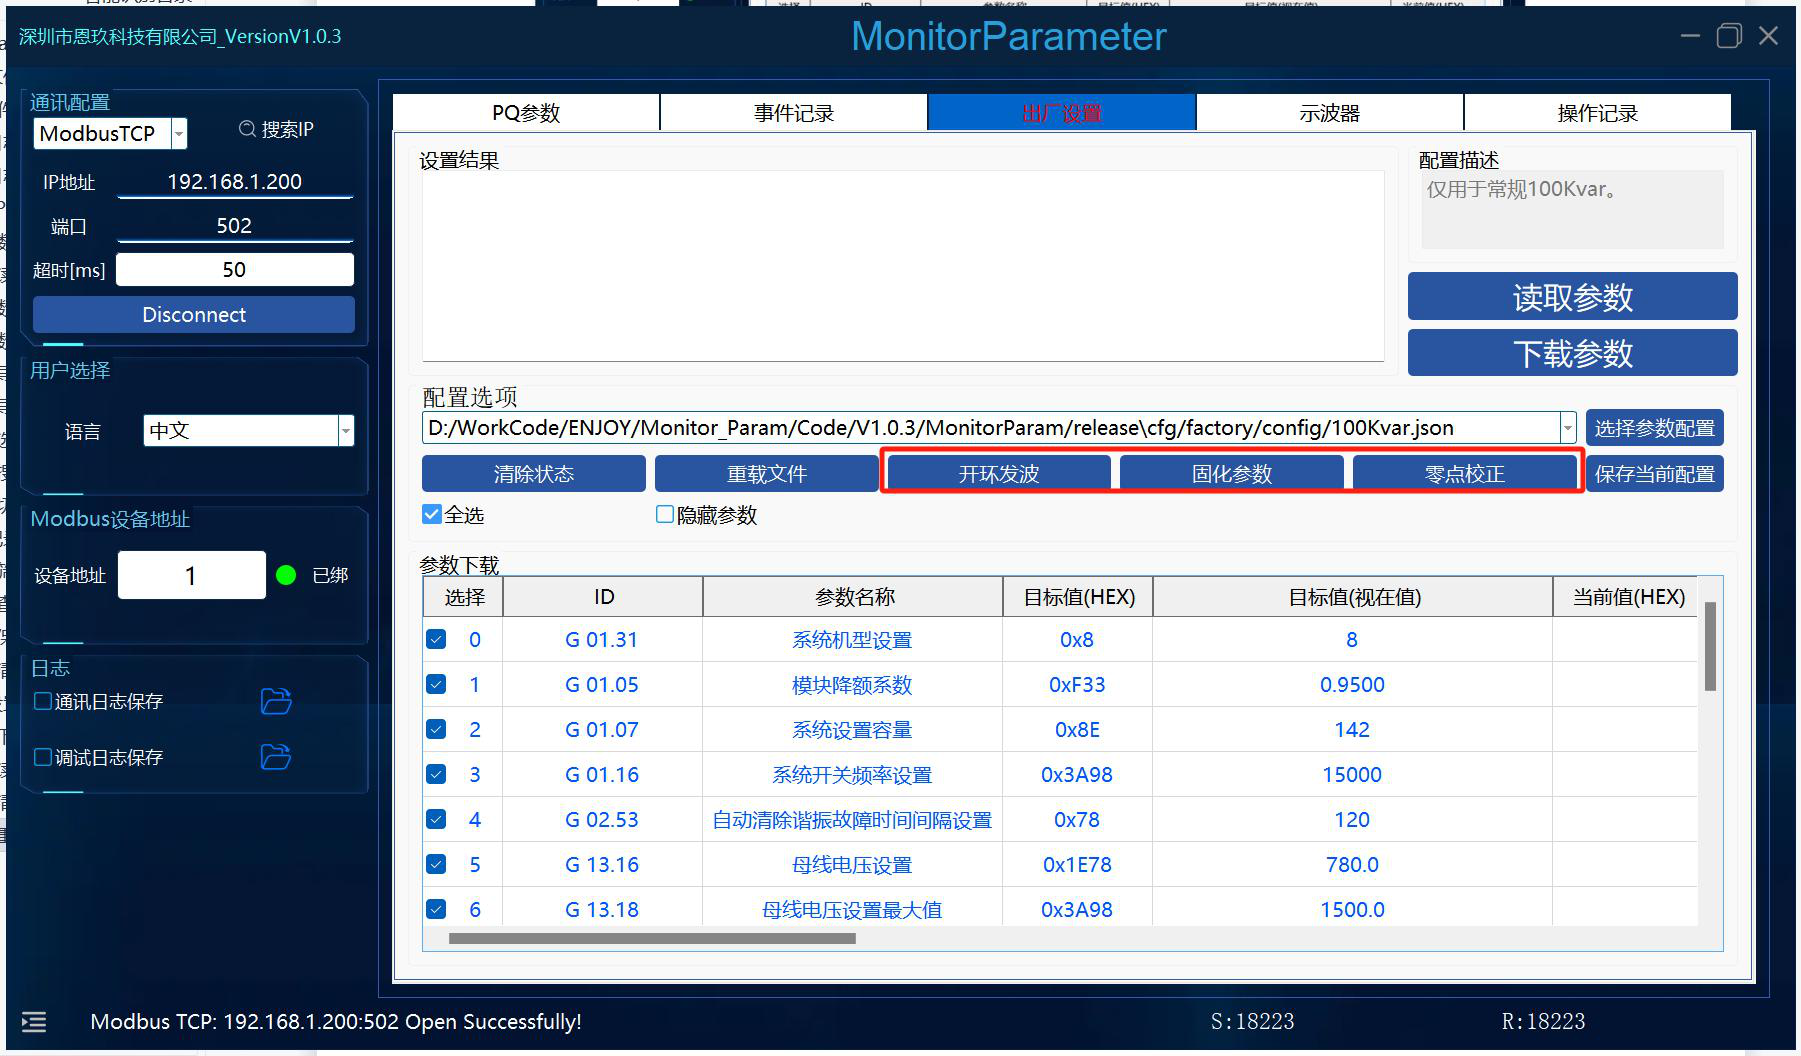
Open-Loop Waveform Output, Parameter Burning (固化参数), and Zero-Drift Calibration are several special commands.
13.6 Save Configuration
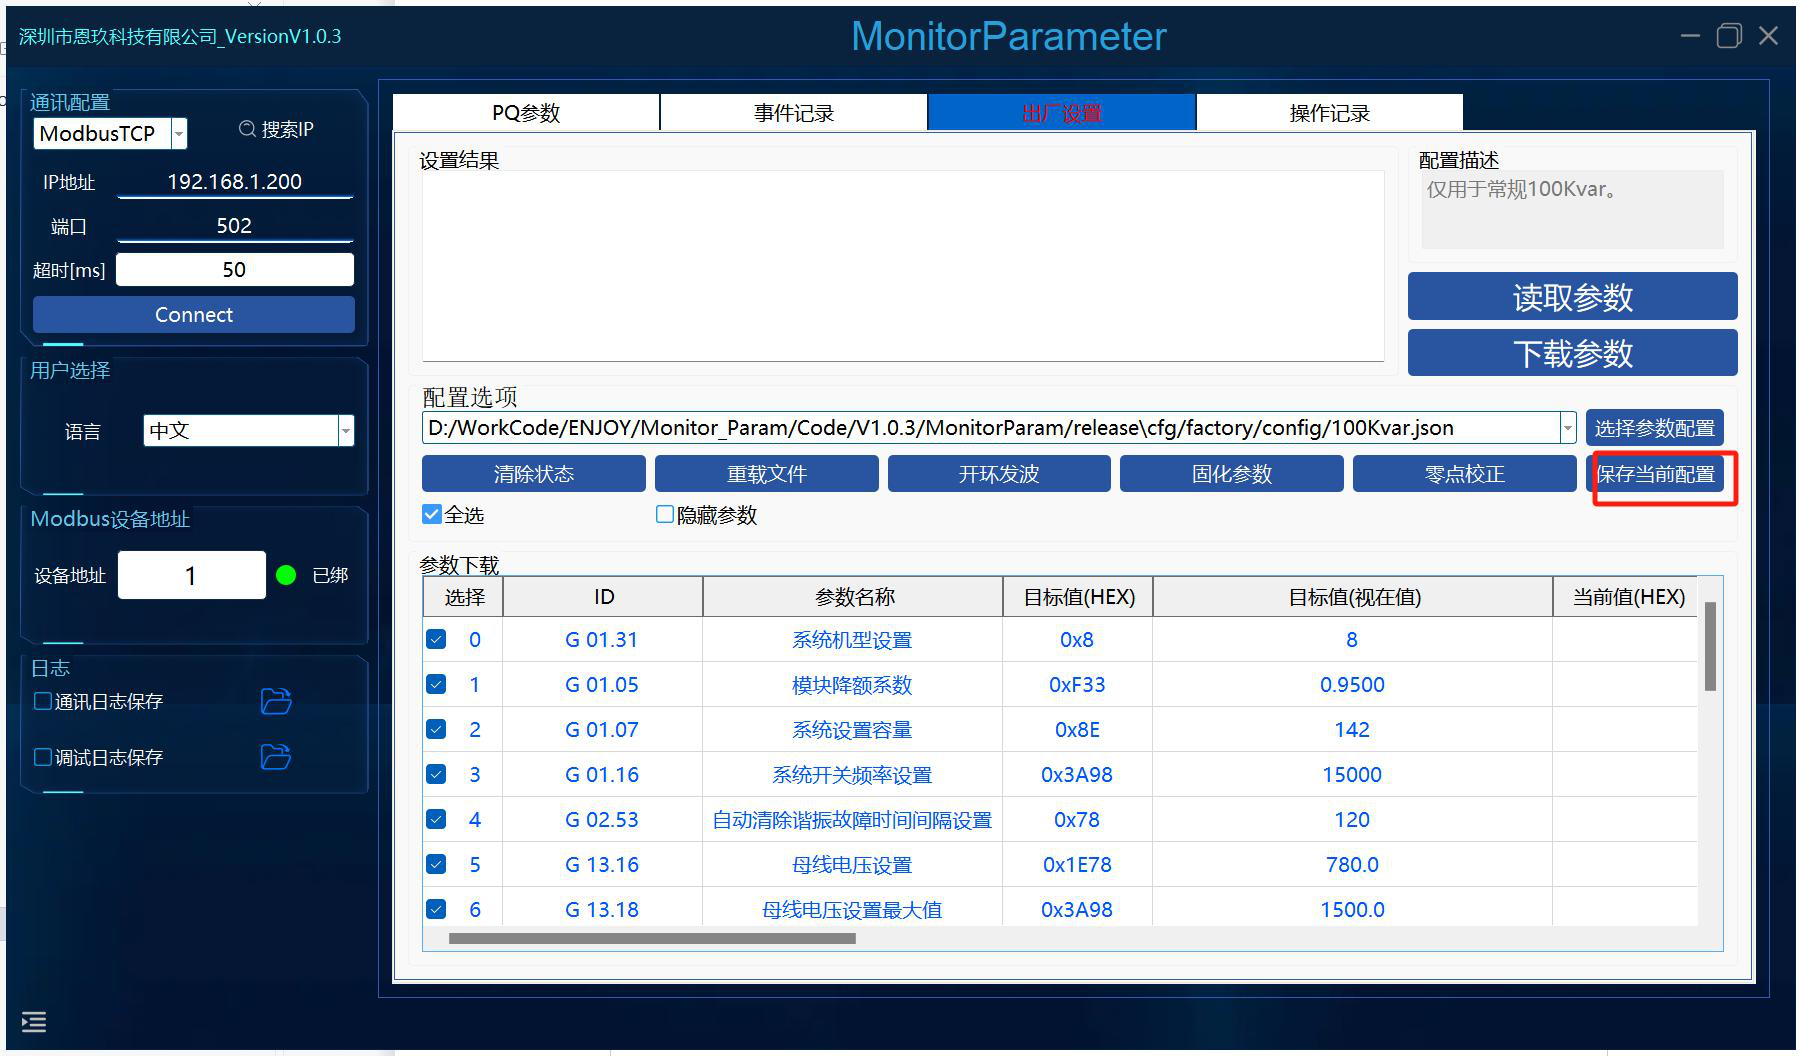
Saved to the selected file.
13.7 Real-Time Save Record
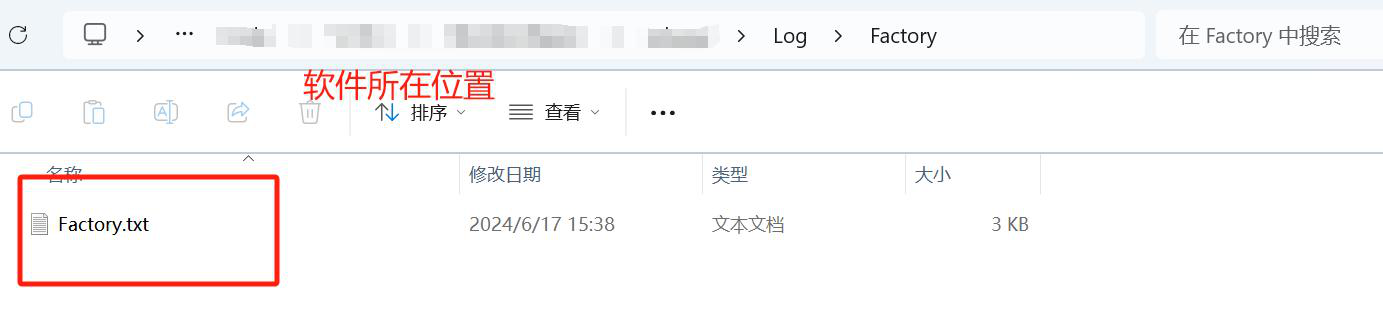
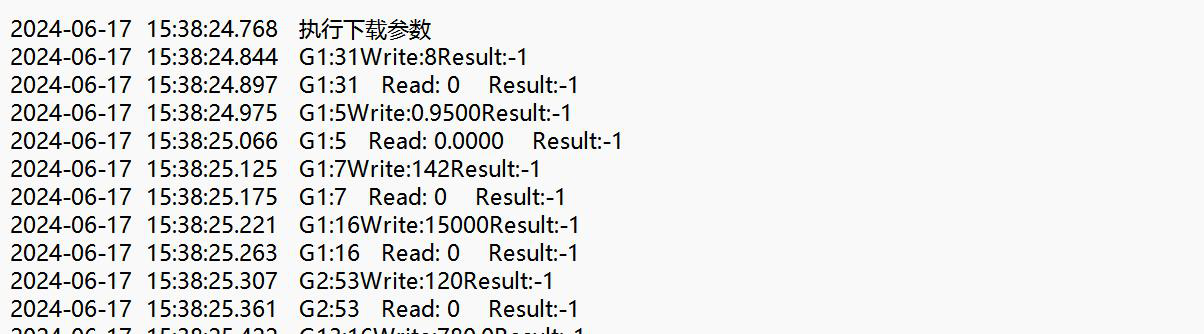
To preserve the records, exiting the Factory Settings page saves the records in a txt file.
13.8 Hidden Parameters
Figure: Hidden Parameters
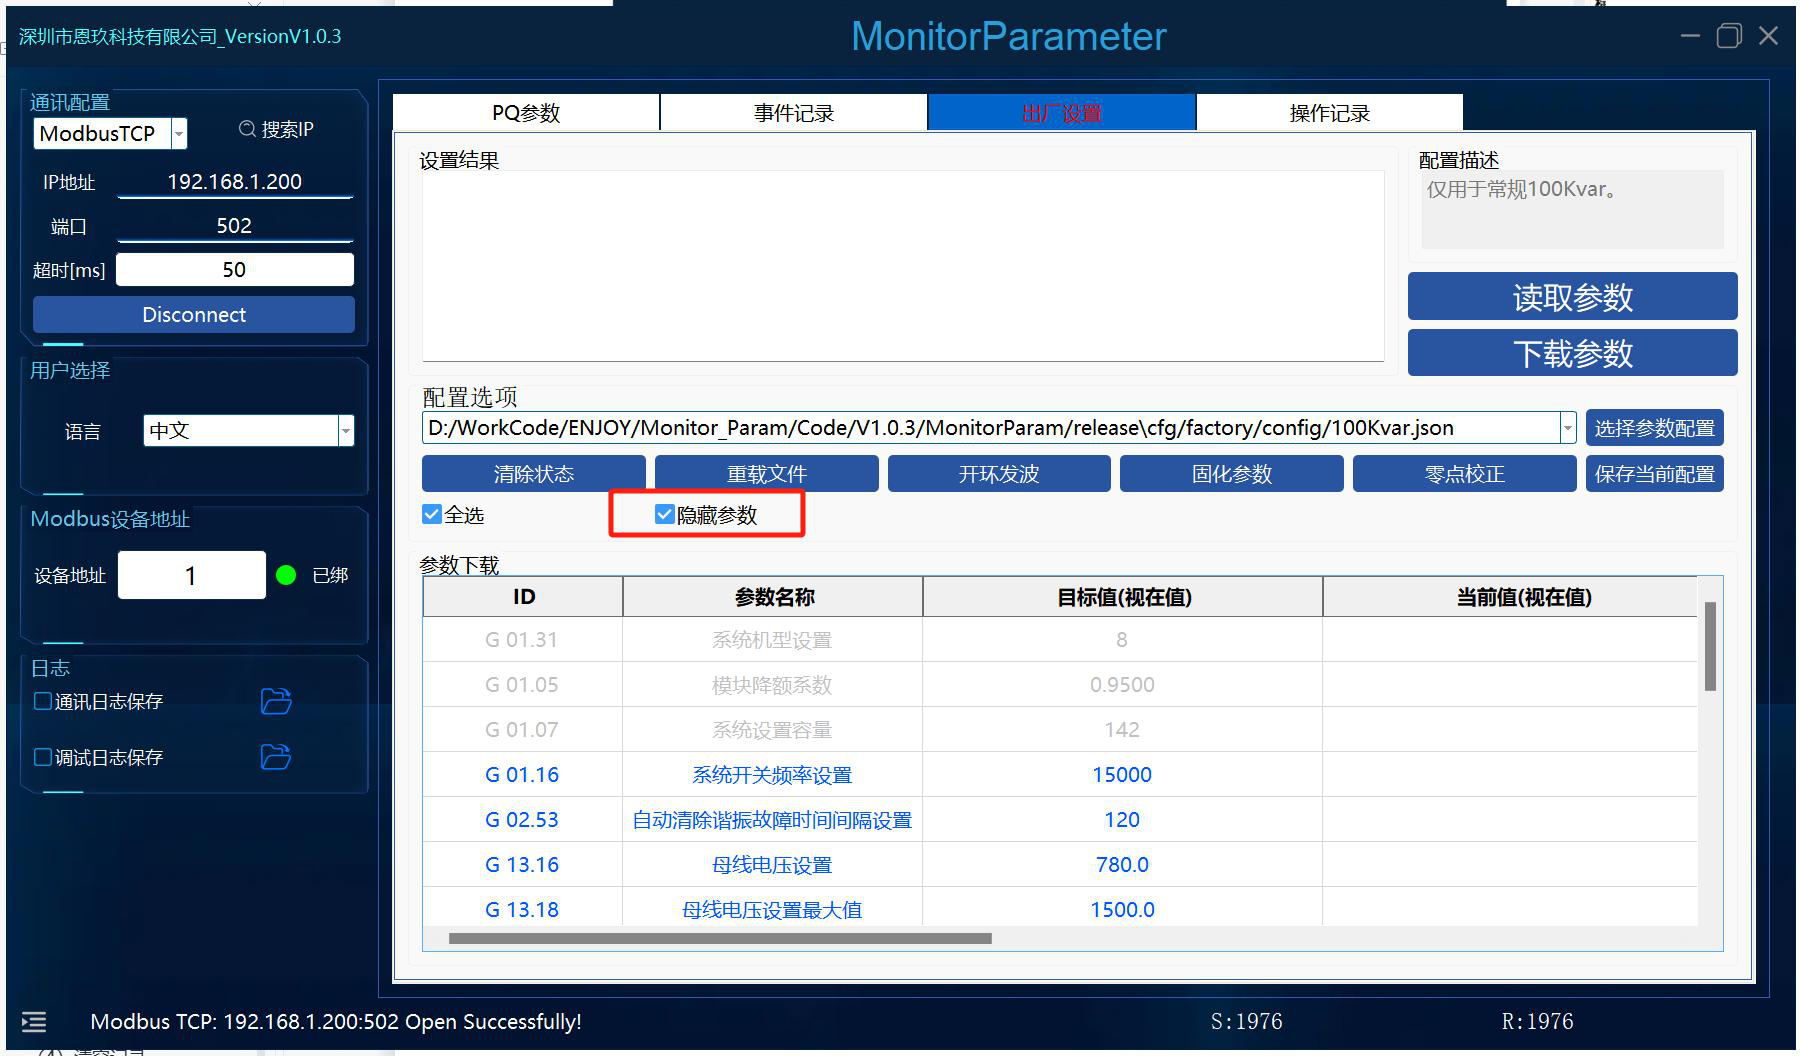
Hide some unnecessary parameters from display.
14. Real-Time Curve Page
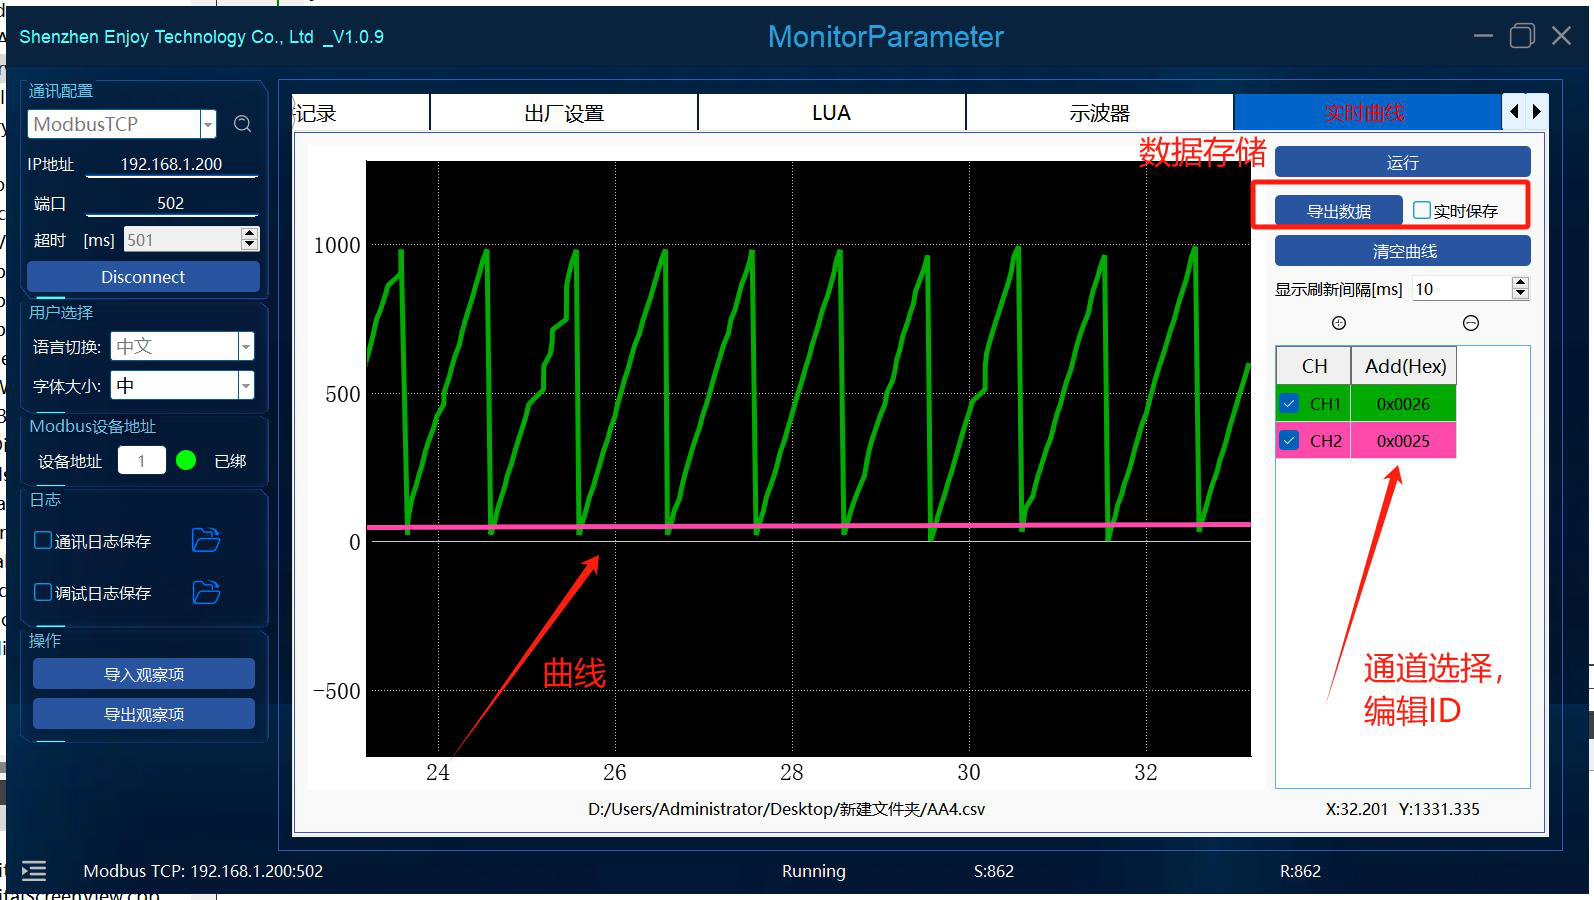
- Auto Save: Enable auto save.
Figure: Real-Time Curve: Auto Save and Export
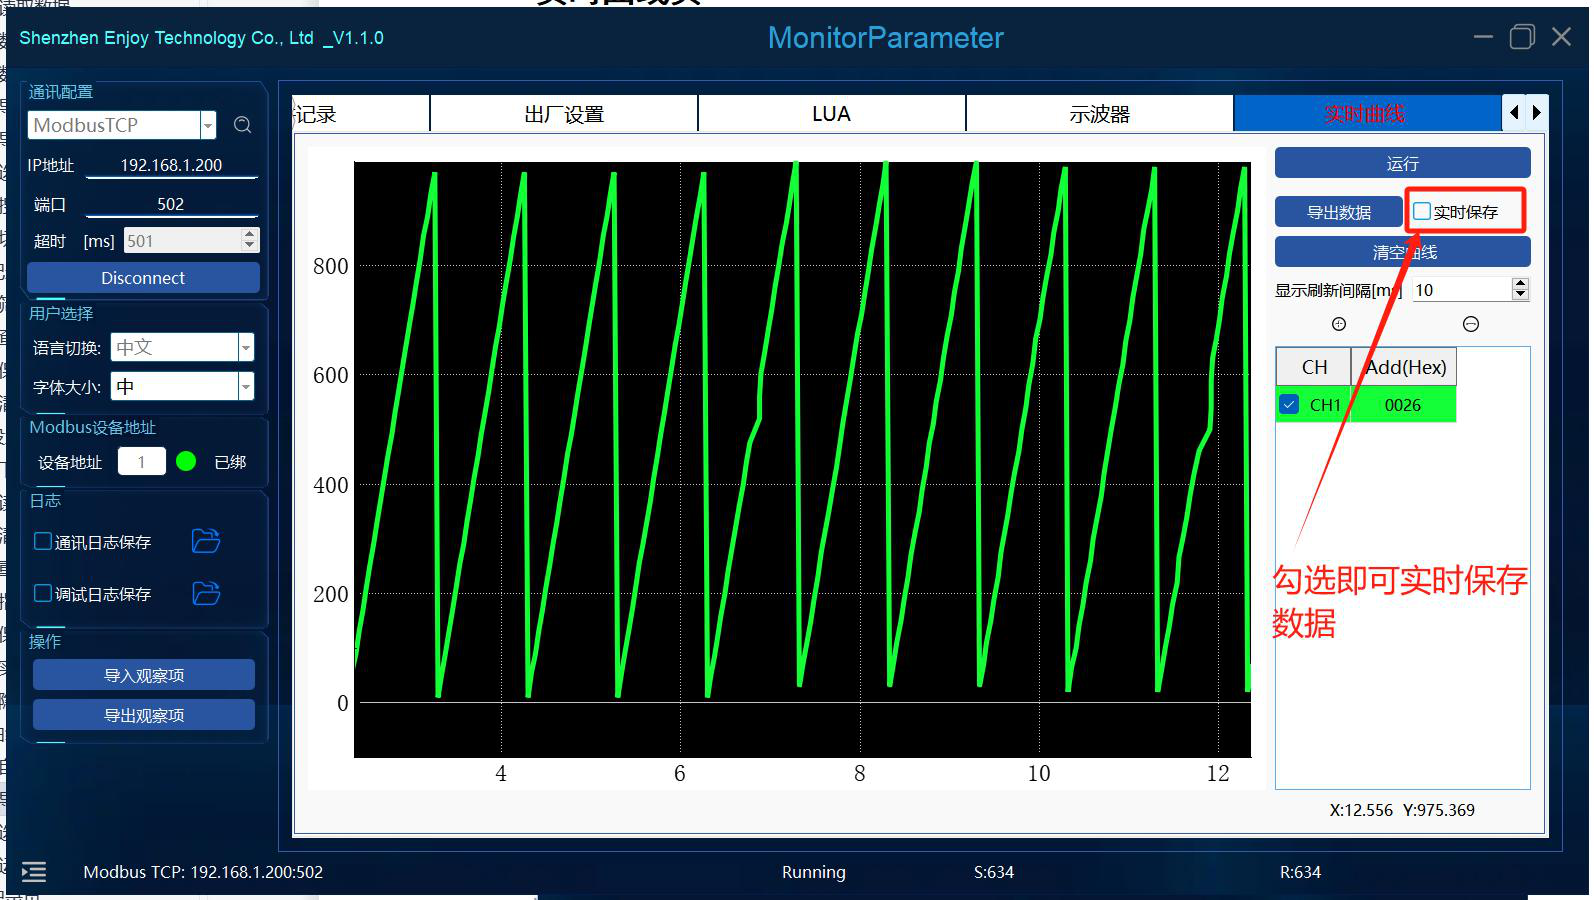
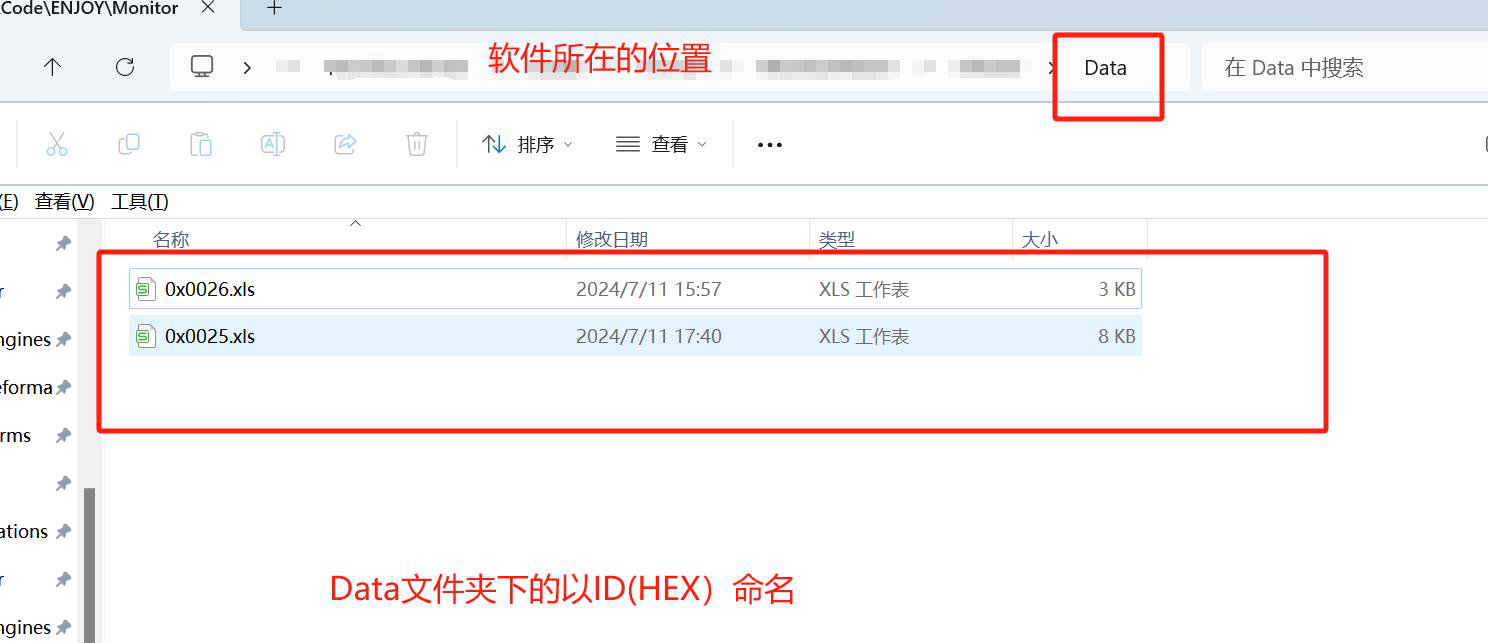
- Export Data:
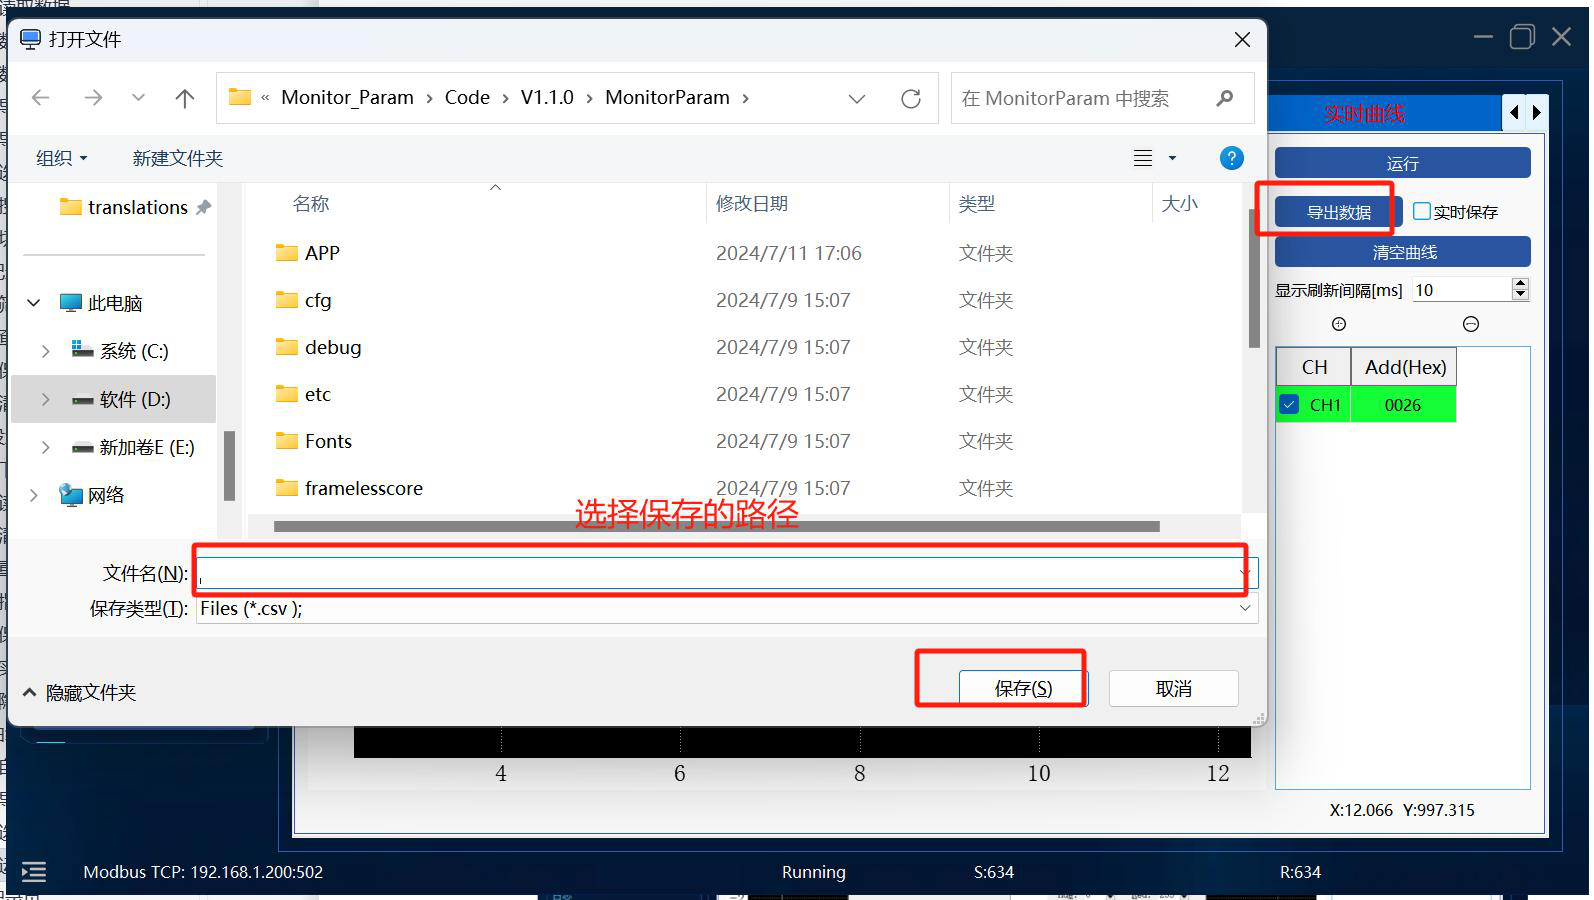
- Short-duration operation → Select the "Export Data" option;
-
Long-duration operation → Select the "Real-Time Save".
-
Select Channel Color:
Figure: Channel Color and Operation
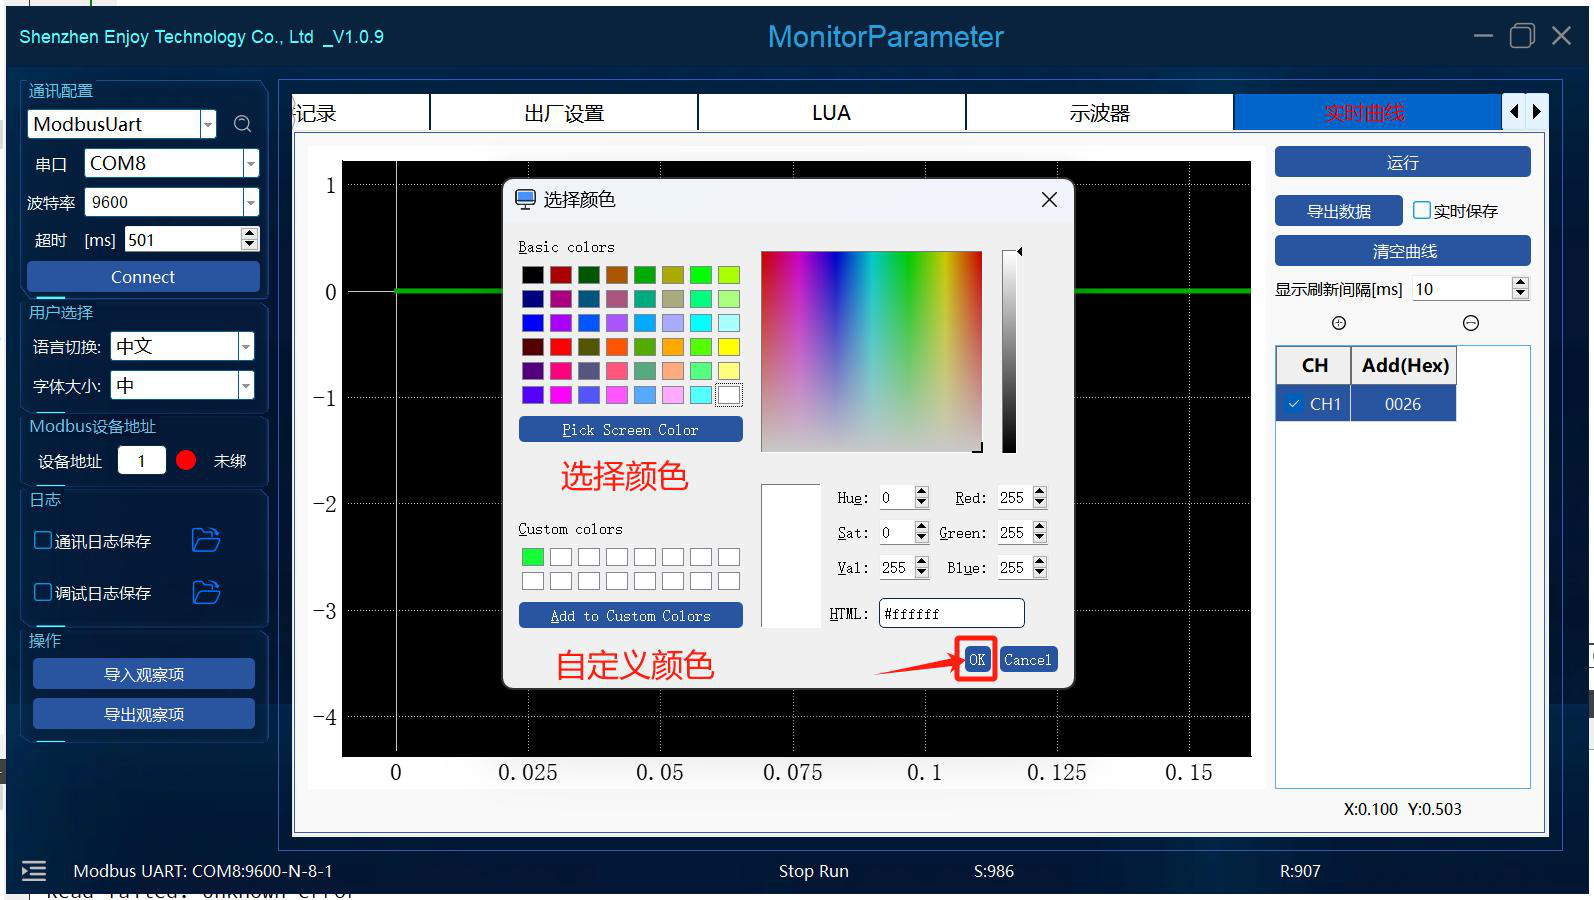
Double-click the corresponding channel in the form on the right; a color palette will pop up, where you can choose a custom color. After closing the dialog box, the corresponding channel will change to the custom color background.
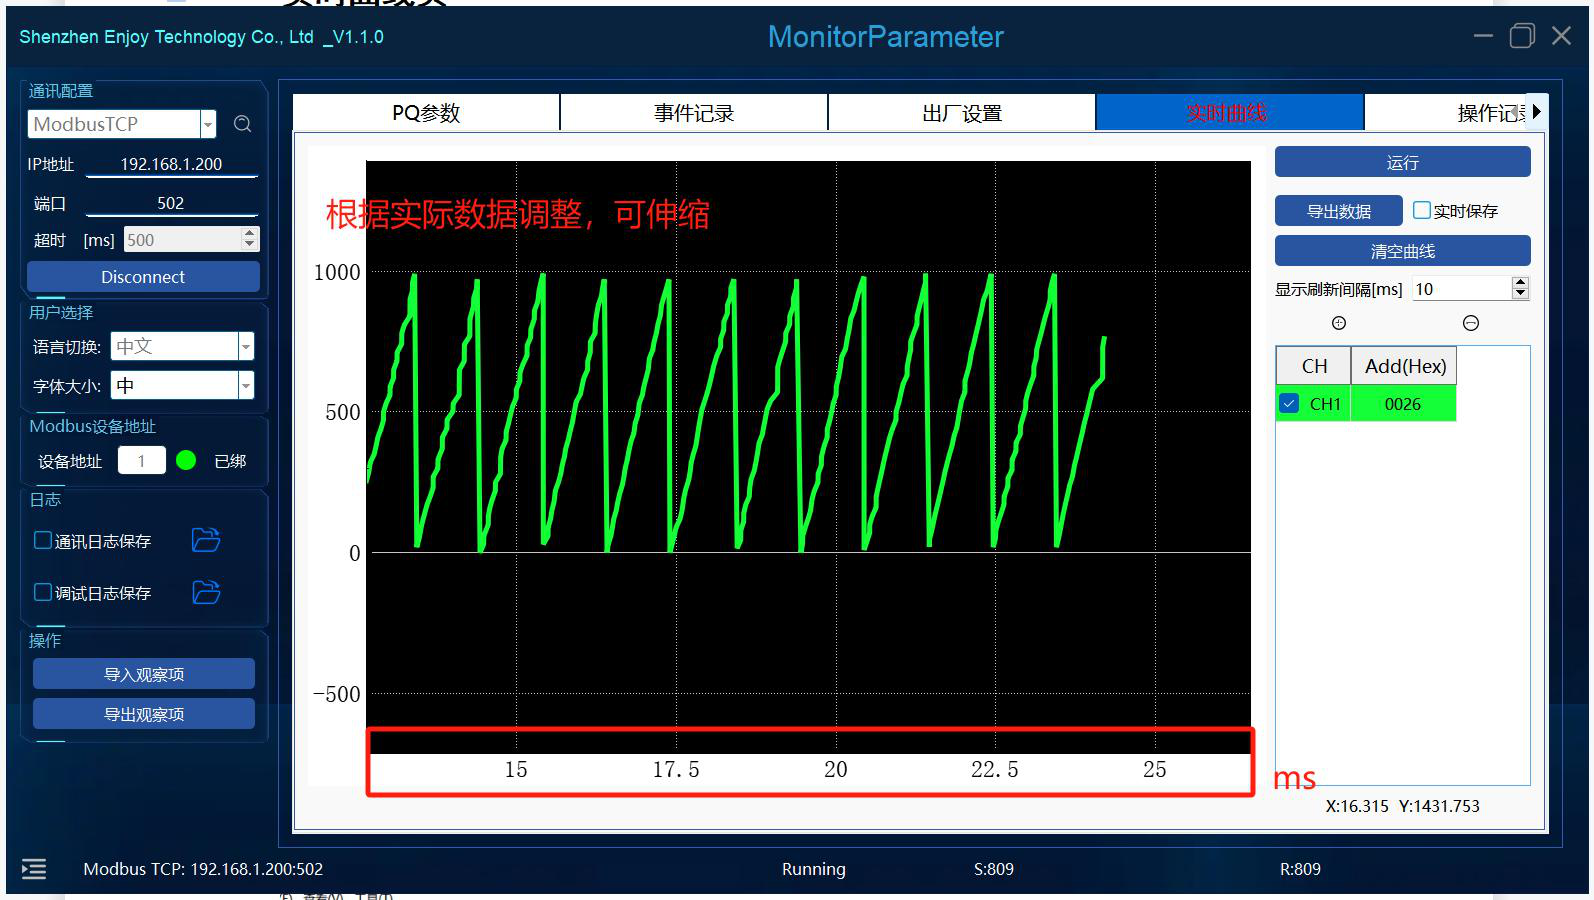
- Run: Supports single-channel and multi-channel operation.
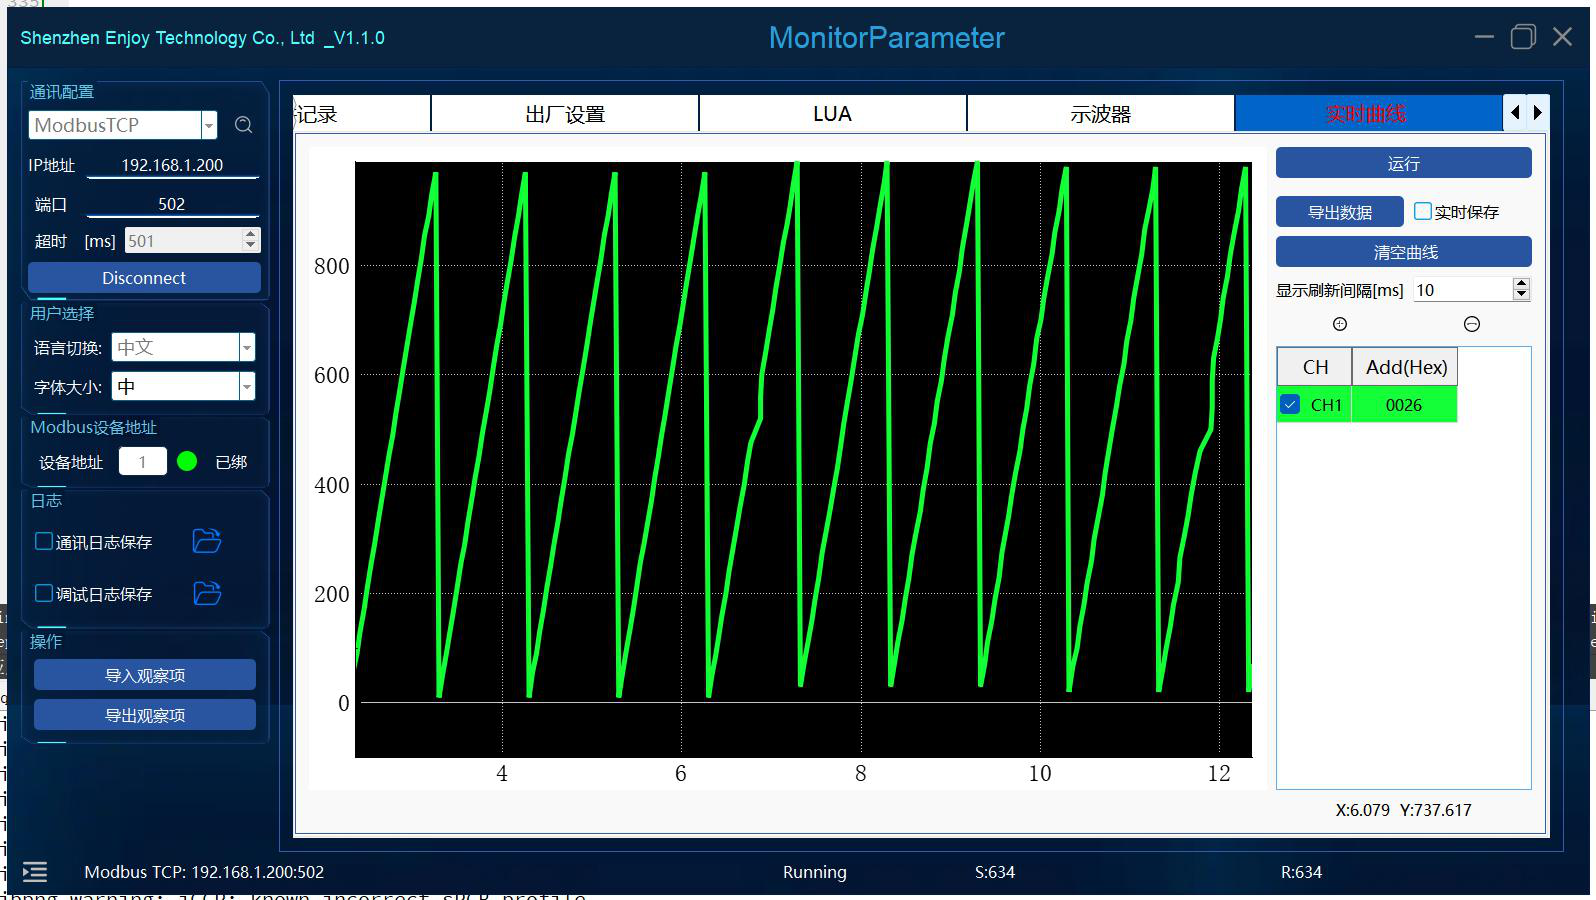
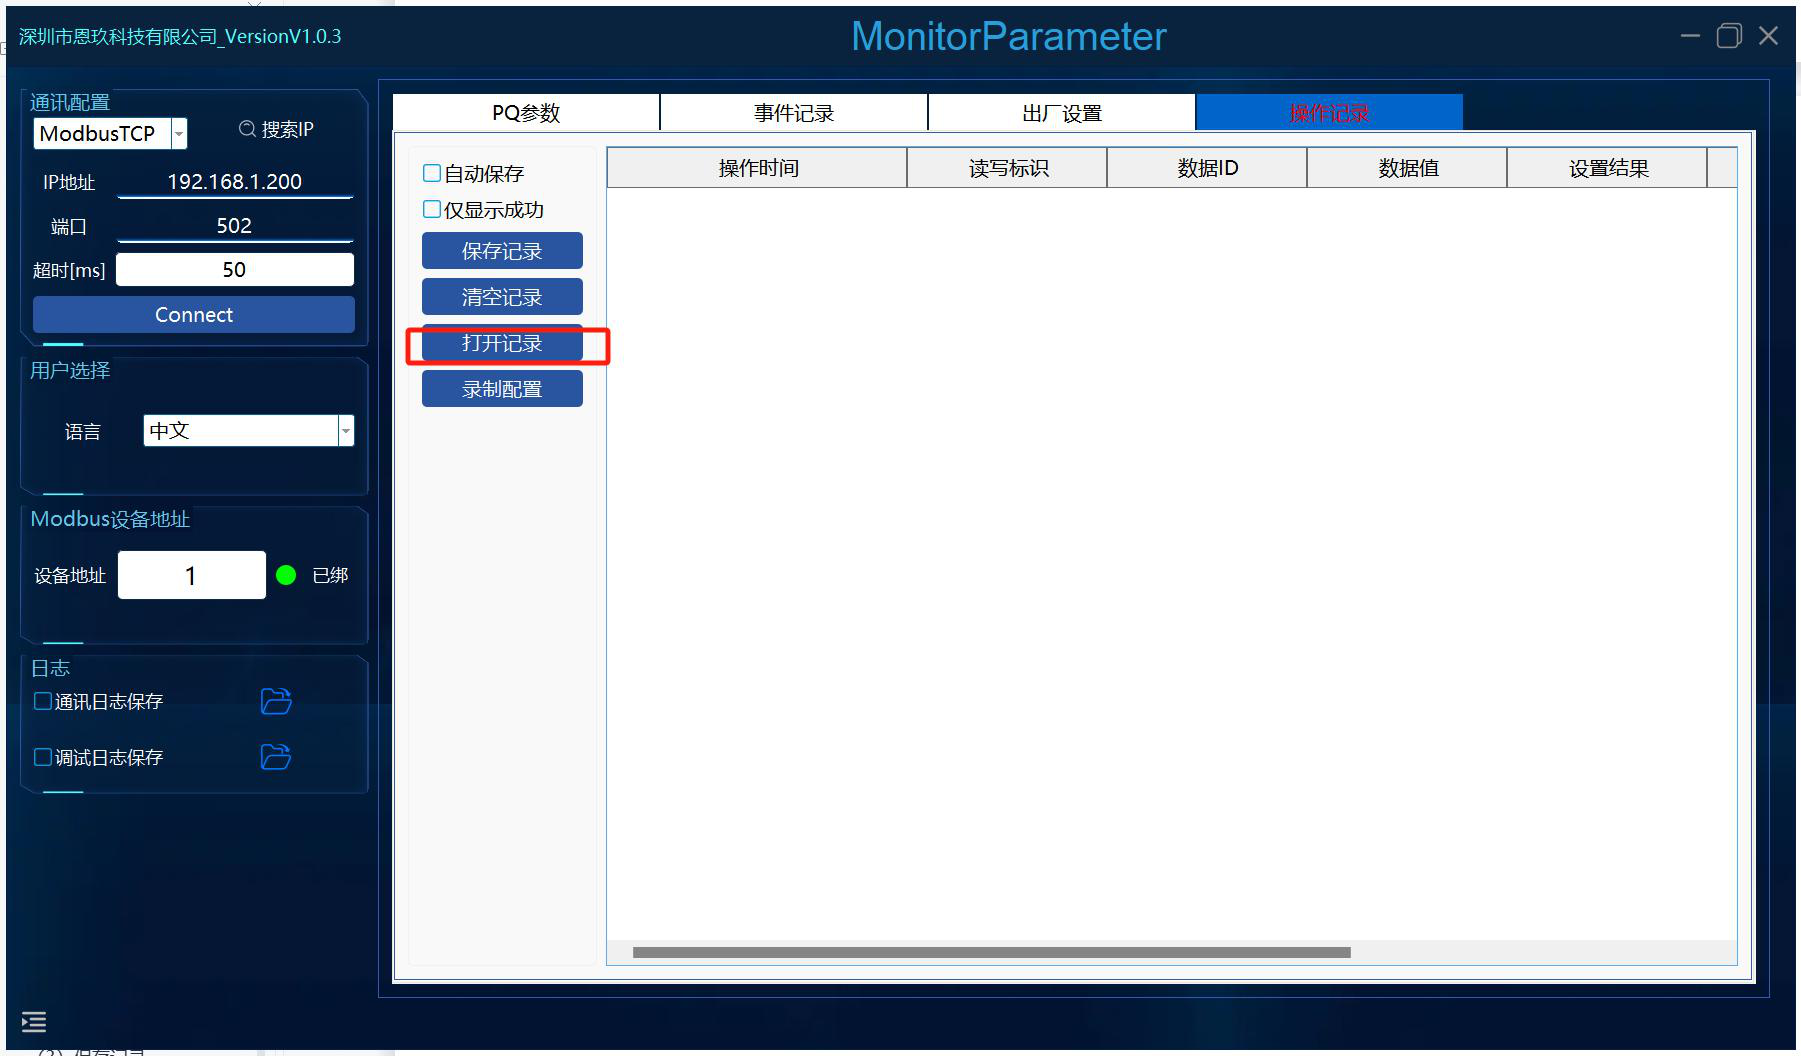
15. Operation Log Page
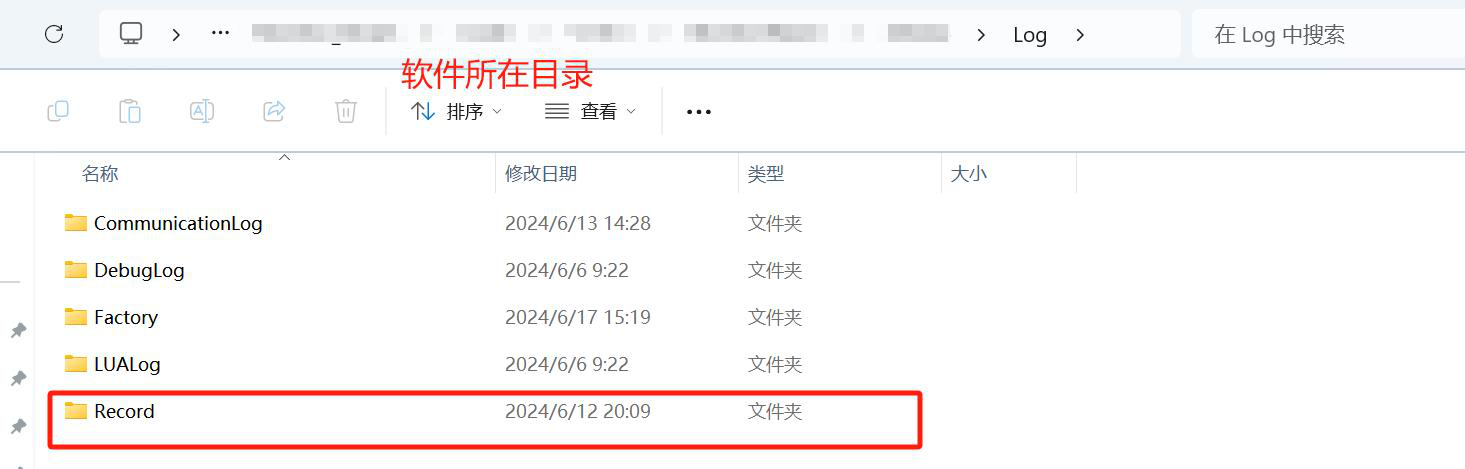
- Auto Save: Auto-saved under the Log folder.
Figure: Operation Log: Auto Save and Filter
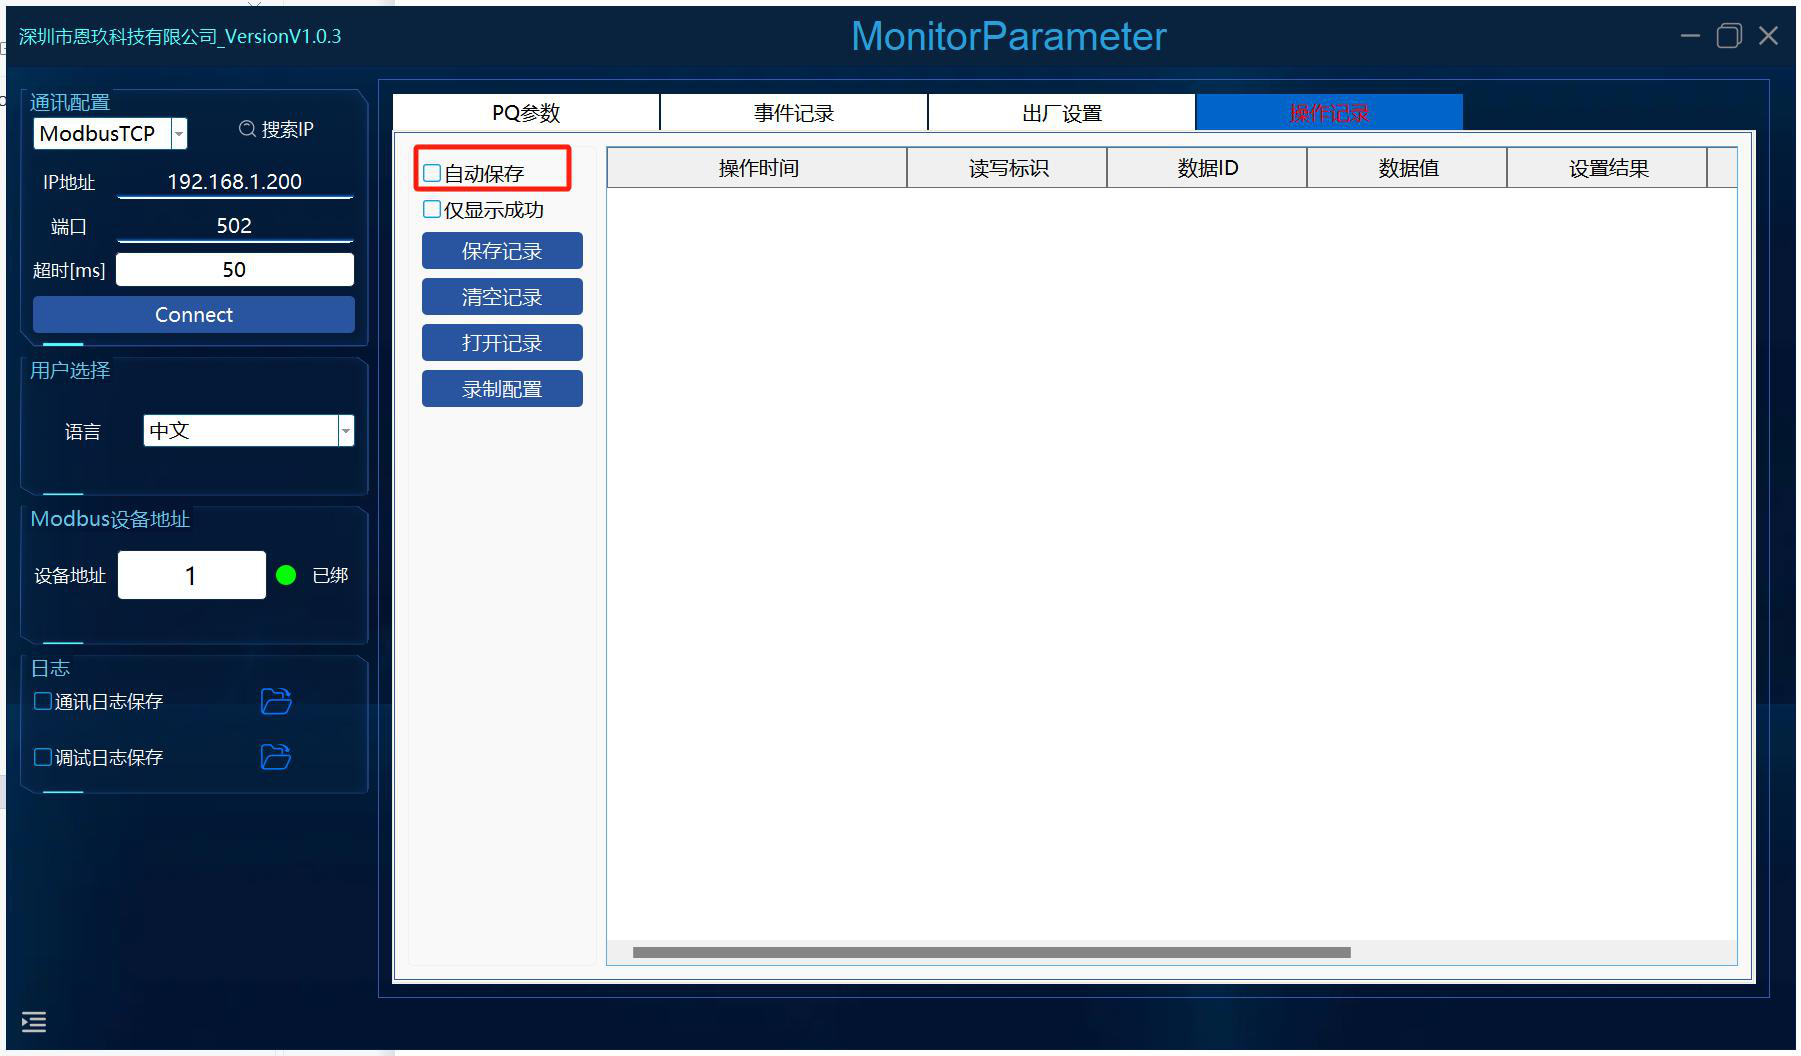

- Show Only Success:
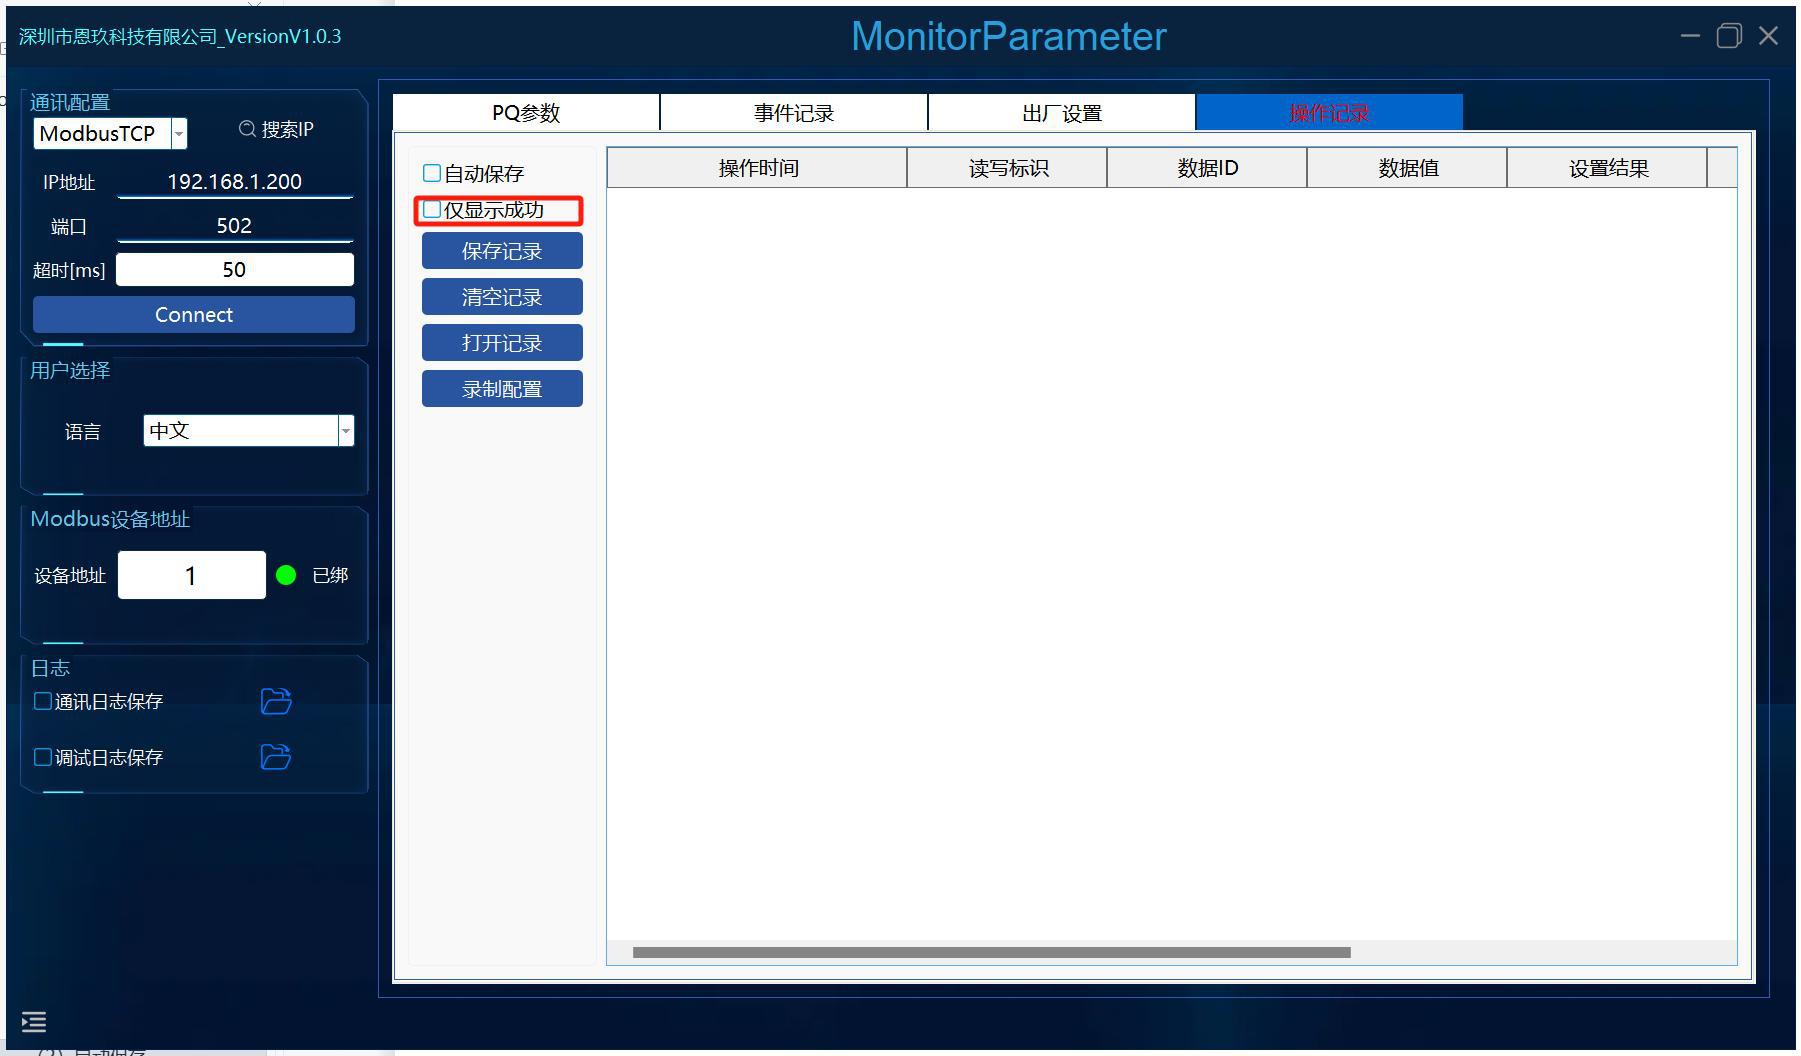
Only successful results are displayed; otherwise, all results are displayed.
- Save Log: Select the save path and click Save.
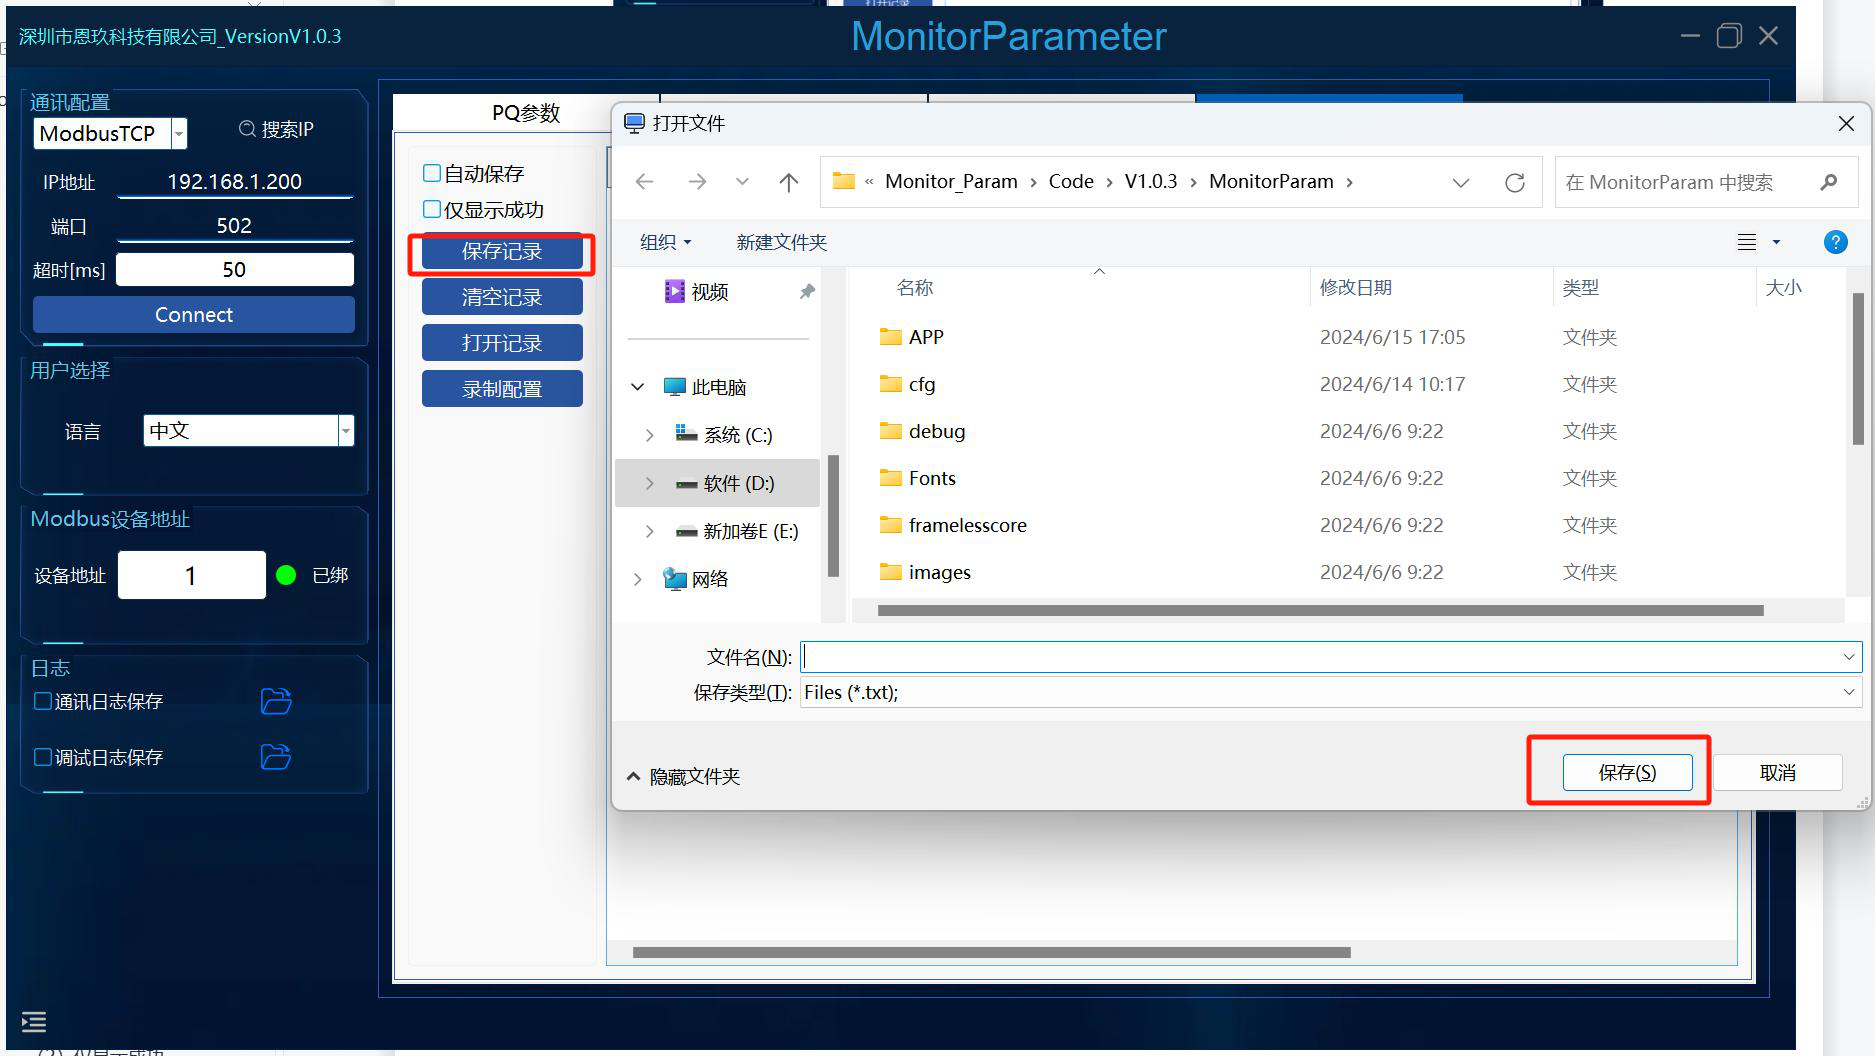
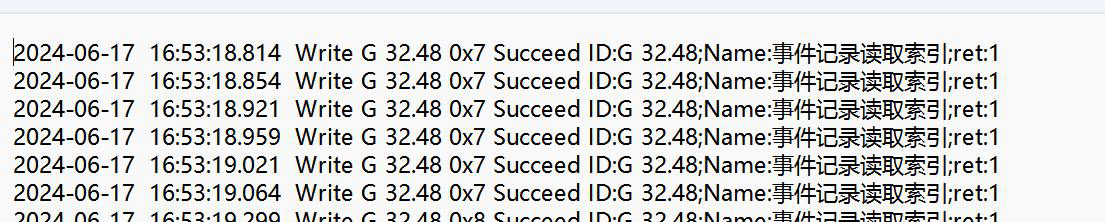
- Clear Log: Clears the records on the interface.
Figure: Operation Log: Save / Clear / Open
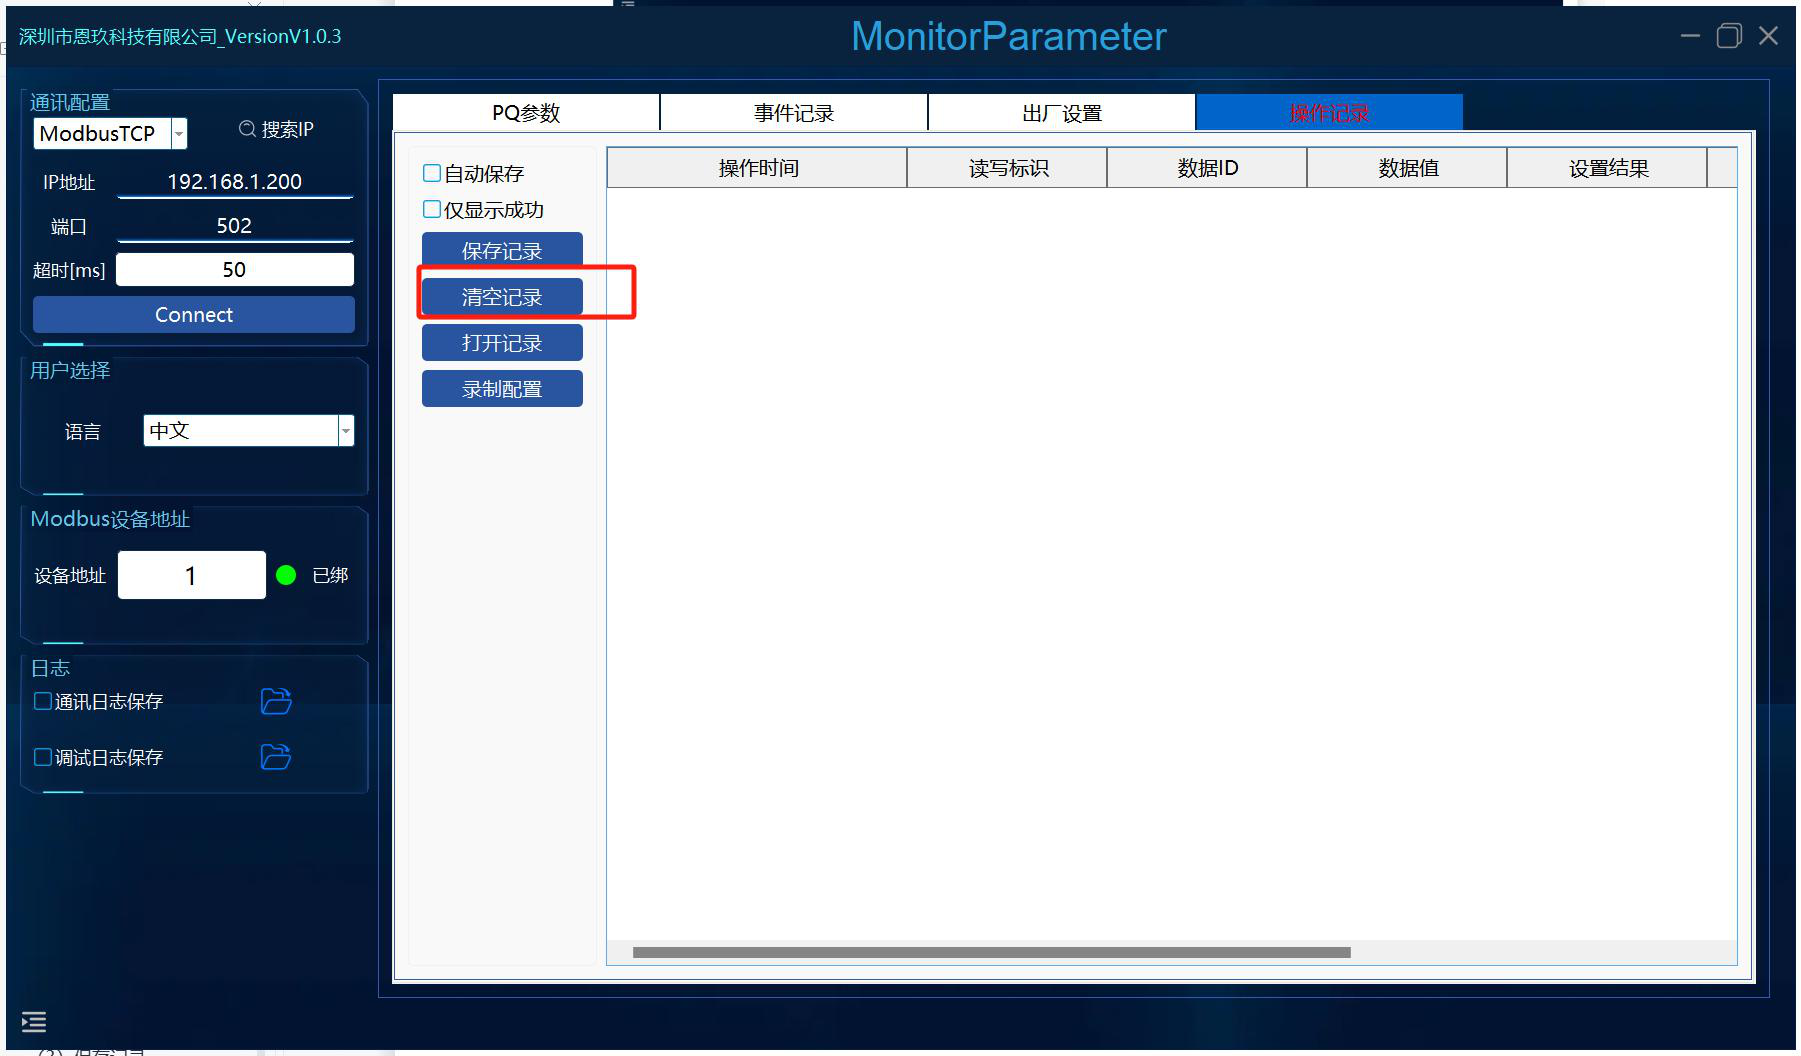
- Open Log: Opens a previously saved log.
- Record Configuration:
Figure: Open Log and Record Configuration
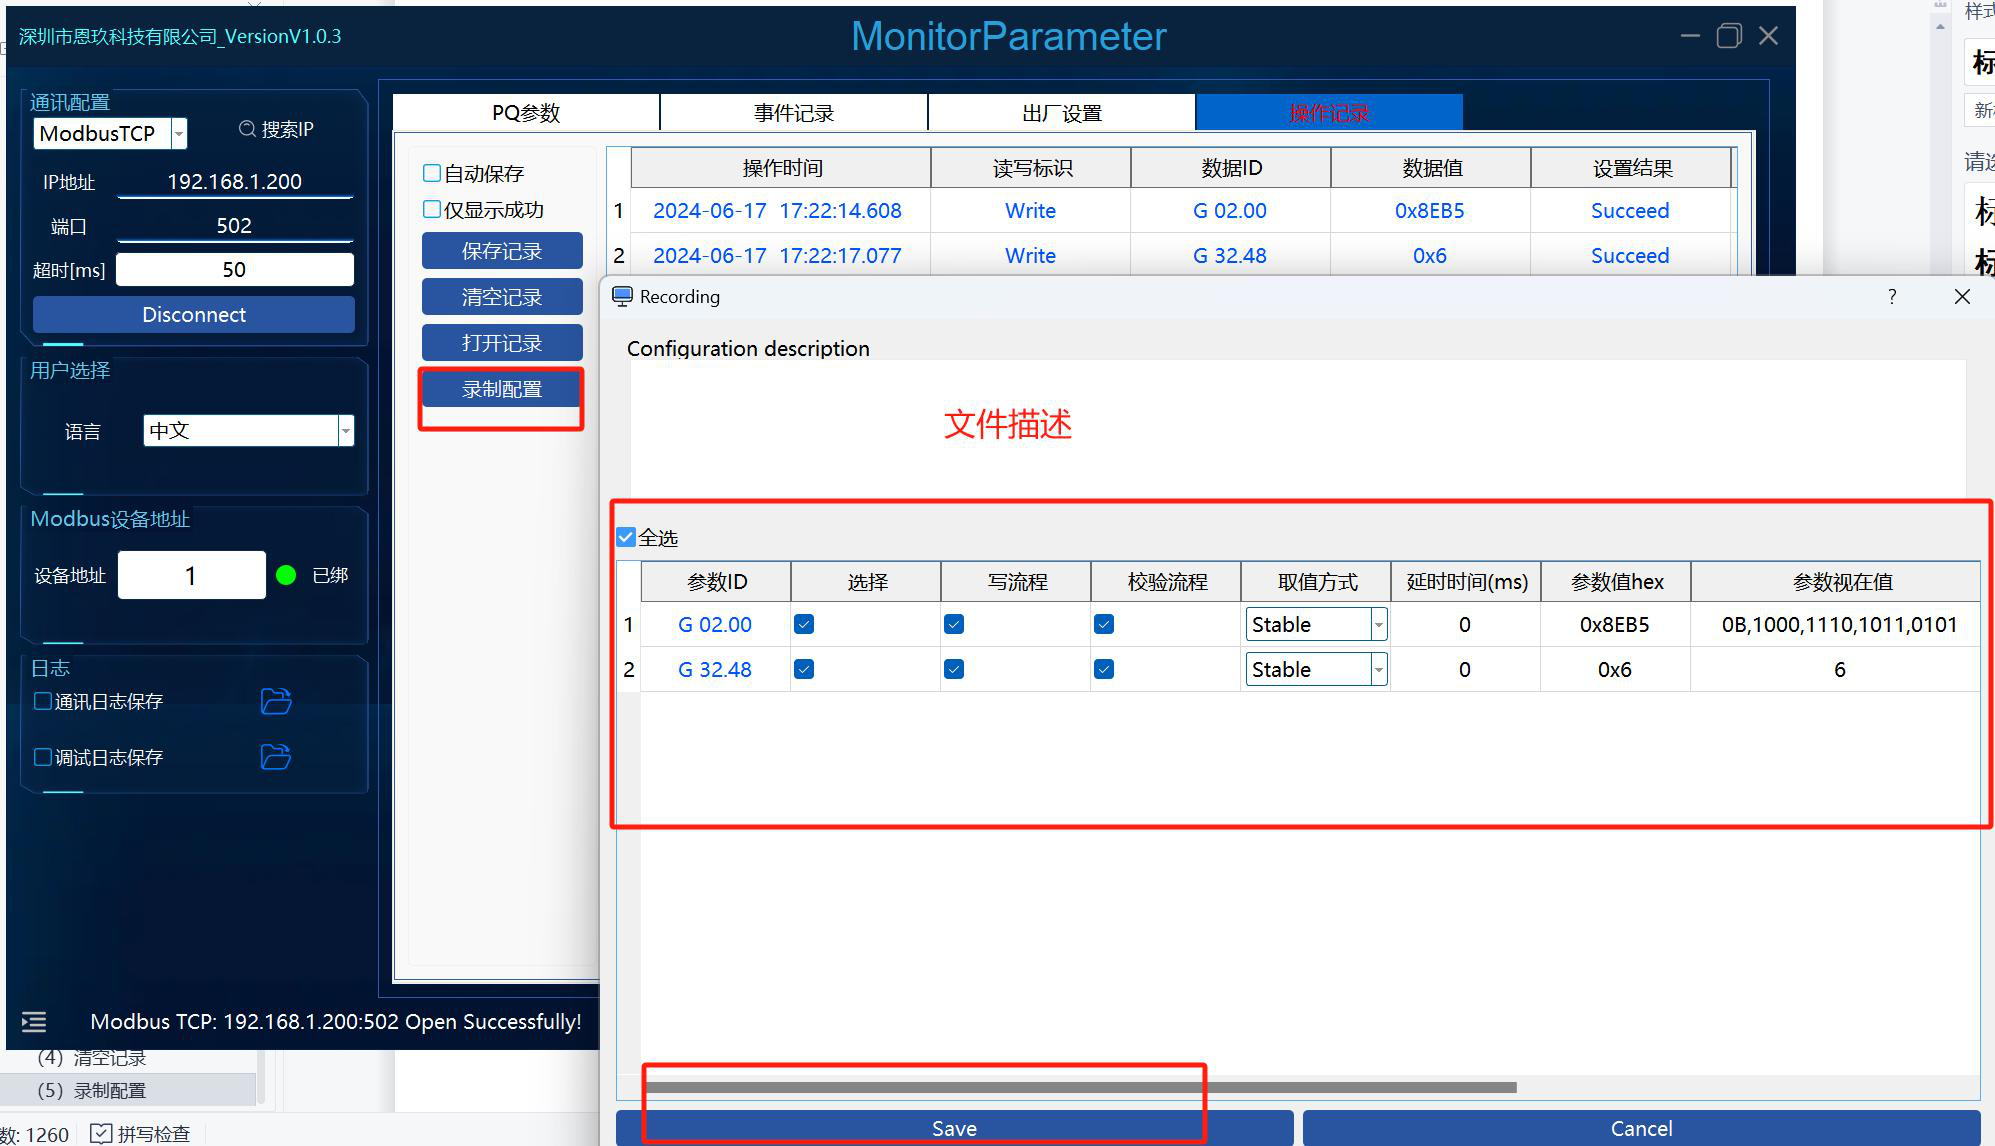
Fill in the file description and click Save to save the content in the log. This function is used for importing factory configuration files.